Dashboard Charts for Jira
Take your Jira dashboards to the next level with powerful, customizable gadgets and charts. Our Dashboard Gadget app for Jira lets you create visual reports, track issue progress, and monitor key metrics — all from a single dashboard. Whether you're managing agile projects, sprints, or service requests, our app provides flexible data visualization tools to help your team stay informed and make data-driven decisions.
Designed for Jira Cloud, this app is perfect for project managers, scrum masters, and team leads who need better reporting and at-a-glance insights. No coding required — just plug and play.
Start building smarter Jira dashboards today with powerful, professional-grade gadgets.
Access the app
Open “Dashboards” from your top Navigation bar. And create a new Dashboard.
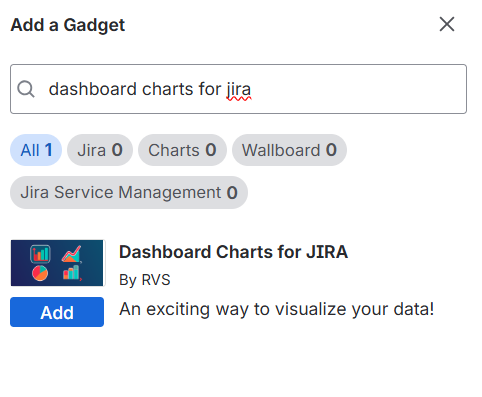
Once a dashboard is created, click on “Edit” and “Add a Gadget”. Search for gadgets by the name of Votazz.
You will find the “Dashboard Charts for Jira” gadget.
Configuration
After adding the gadget, you can configure the same with the values for the below fields as per your need.
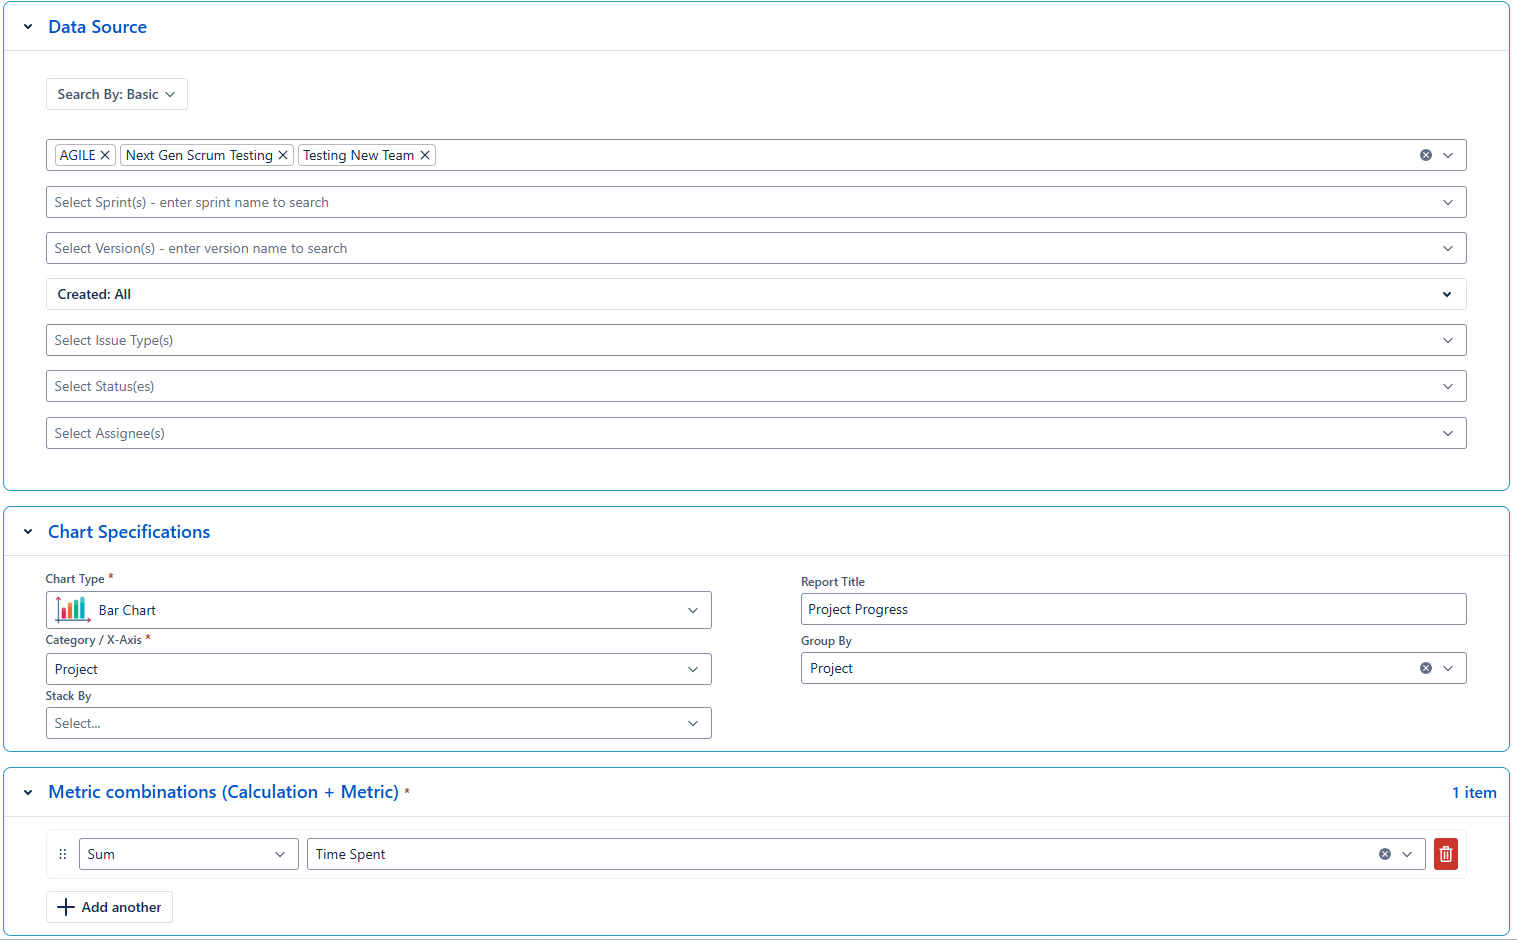
Configuration Fields :
Project(s)
Sprint(s)
Version(s)
Created
Issue Type(s)
Status(es)
Assignee(s)
Chart Type:
Bar Chart
Stacked Bar Chart
Stacked Area Chart
Line Race Chart
Line Chart
Category / X-Axis
Group By
Calculation :
Sum
Count
Average
Median
Metric / Y-Axi
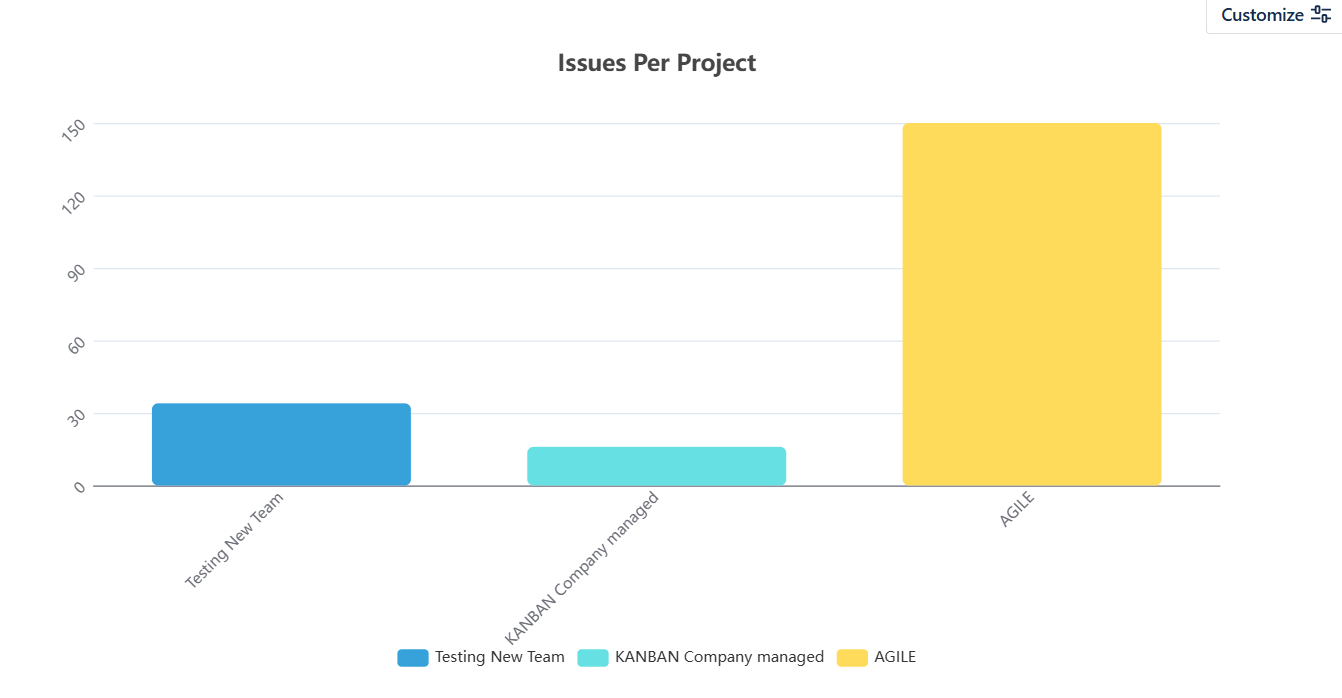
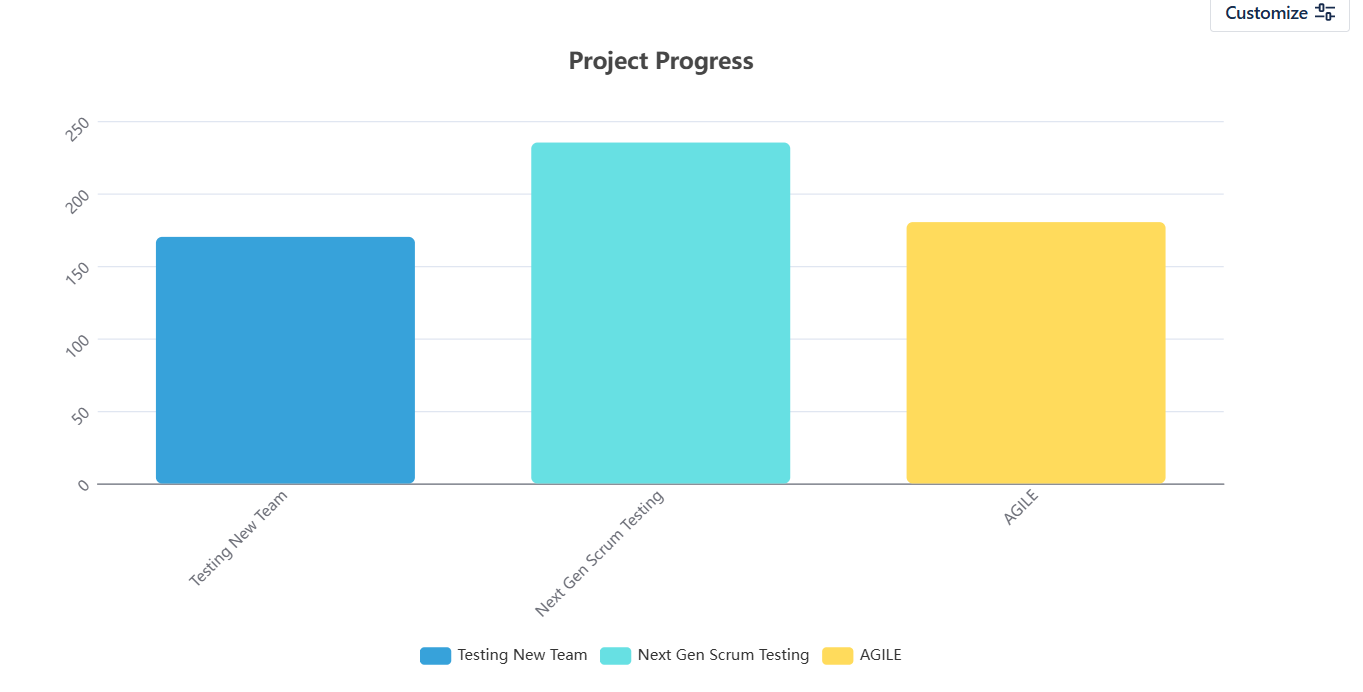
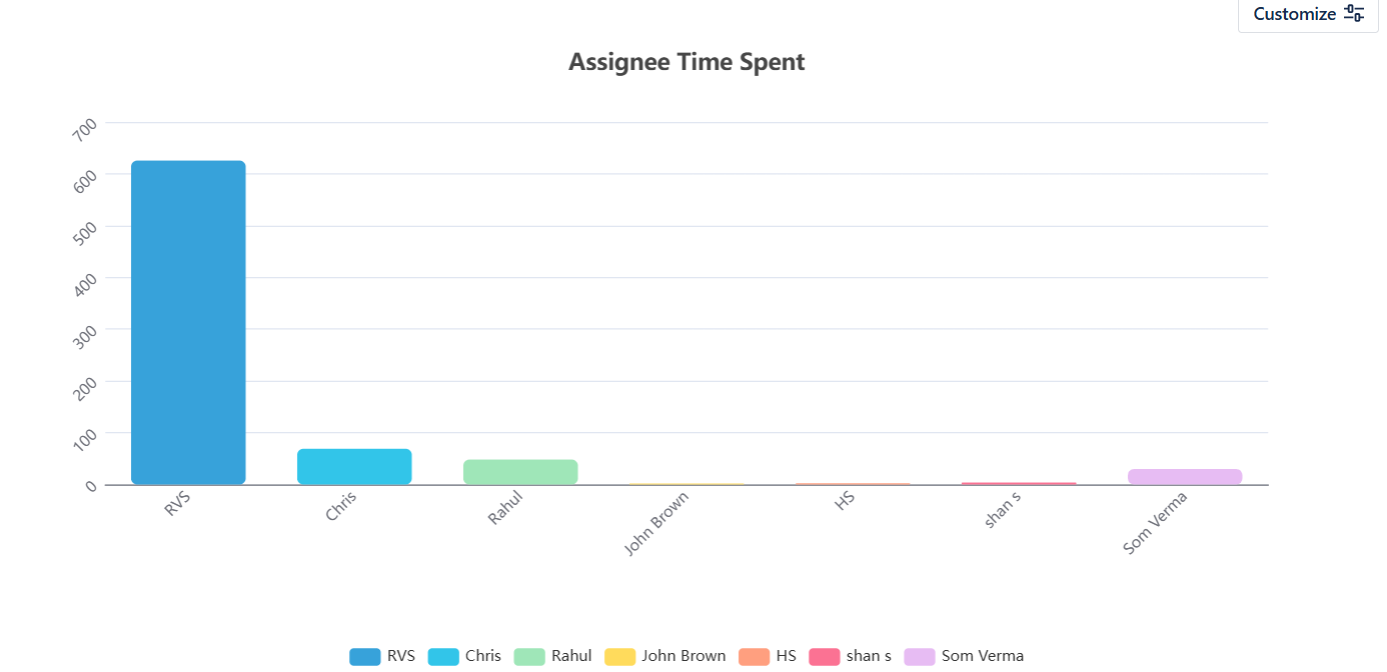
Example charts
After saving the configuration, you will see the gadget as below
Help & Support
Please raise a support request here, or email us at support@votazz.co.
To help us respond quickly and accurately, include the app version, your Jira version, your browser, and the steps to reproduce the issue with examples or screenshots.