Agile Tools – Epic Tree & Time in Status
Overview
To visualize the complete progress of a project in Jira, you certainly need to see the rolled up time estimates and story points of your Epics and see percentage completion at project level. Rolled up means summing up from Sub Task -> Story or Task -> Epics.
However while implementing SAFe, there is an issue hierarchy with more than just 2–3 levels. Many teams implement issue hierarchy like
Strategic Theme -> Business Epic -> Feature -> Story or Task -> Story or Task -> Sub-task
To achieve this in Jira, teams use Issue Link “is parent of” or “is child of” between Issues, instead of Epic Links. Because Epic Links can’t be chained between many levels. Issue Links doesn’t have any restrictions on chaining/levels. There may also be Issue Links for Dependencies or Blocking or Related.
Some teams also use Advanced roadmaps which allow to create levels above Epics.
And then to have more control on your project timelines, there is a need to strengthen your processes, to track your bottleneck issues. You need to see which issue has spent most time in which status or with which assignee, and take appropriate actions. Also you need to see where your resources are spending their time.
With the help of Agile Tools, you can achieve all of the above functionalities in one plugin.
Agile Tools - Epic Tree, Links Tree, Time in Status & Worklogs
Key features of the app are :
Epic Hierarchy
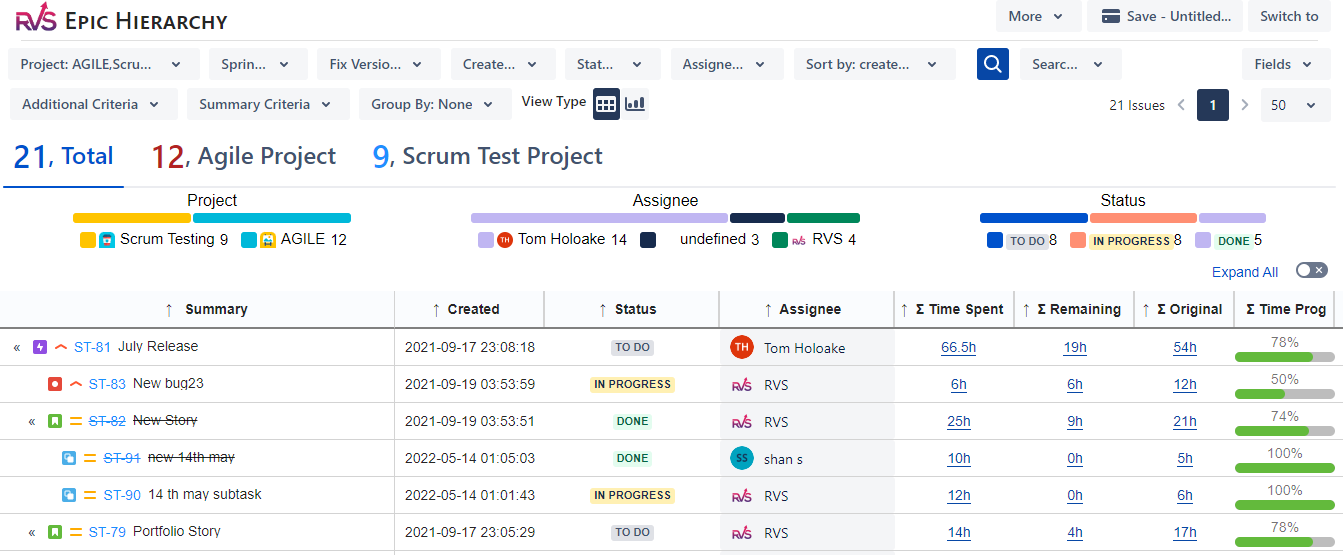
Get an aggregate view of a project Epics in a nested tree. Sum up your Epic’s Time Spent, Original Estimate, Time Remaining, and %age Complete. Edit all key Jira fields on the hierarchy screen.
Links Hierarchy
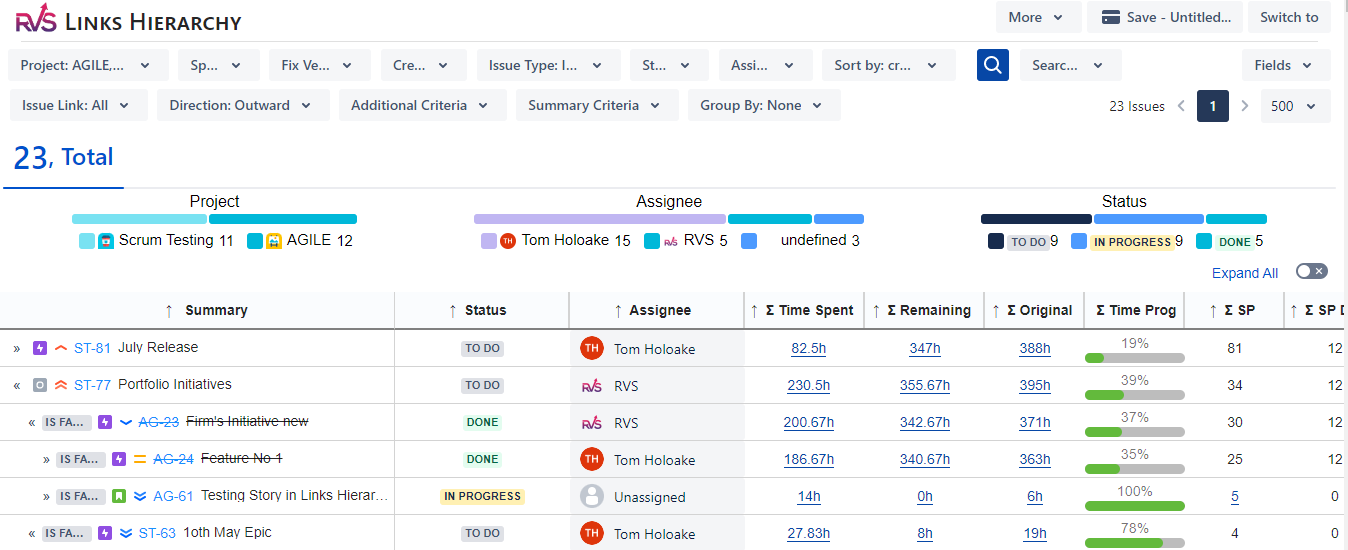
View up to 10 level of hierarchy based on your Issue Links. Sum up for Time Spent, Original Estimate, Time Remaining, and %age Complete. Edit all key Jira fields on the hierarchy screen.
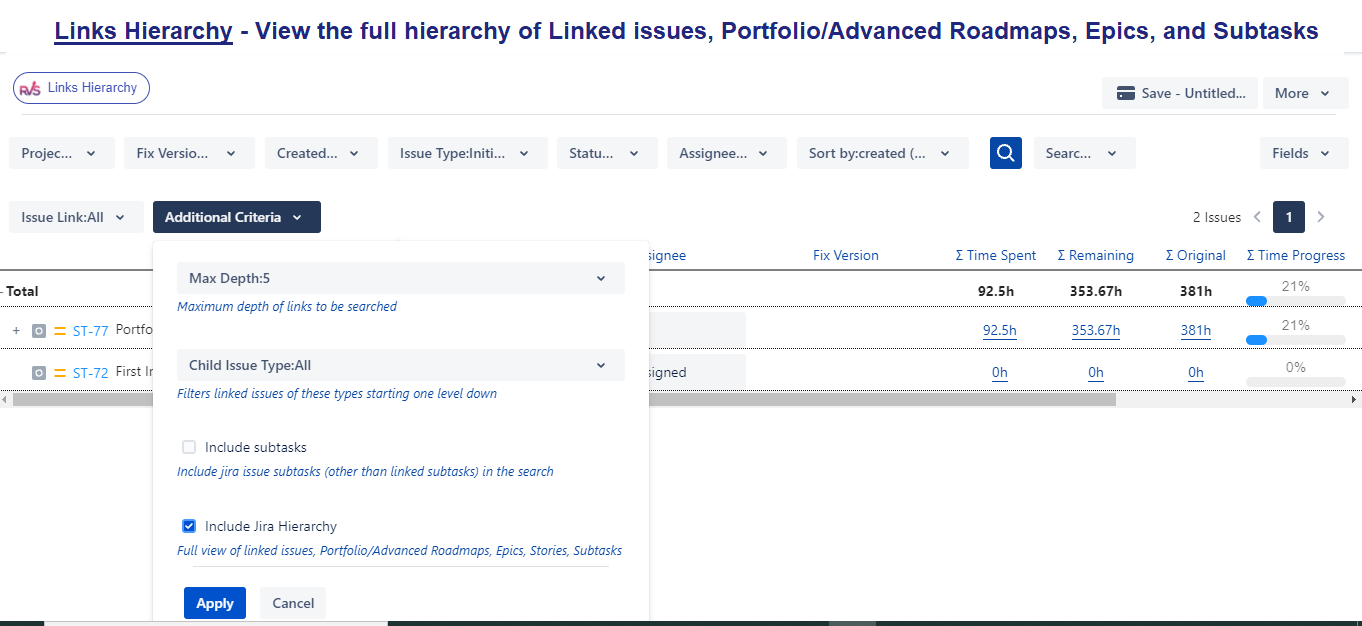
The Portfolio/Advanced Roadmaps Hierarchy too can be visualized and tracked on this screen. For that you need to select your top level issue type, eg Initiative, from the “Issue Type” filter and select “Include Jira Hierarchy” from the additional search box.
Time in Status
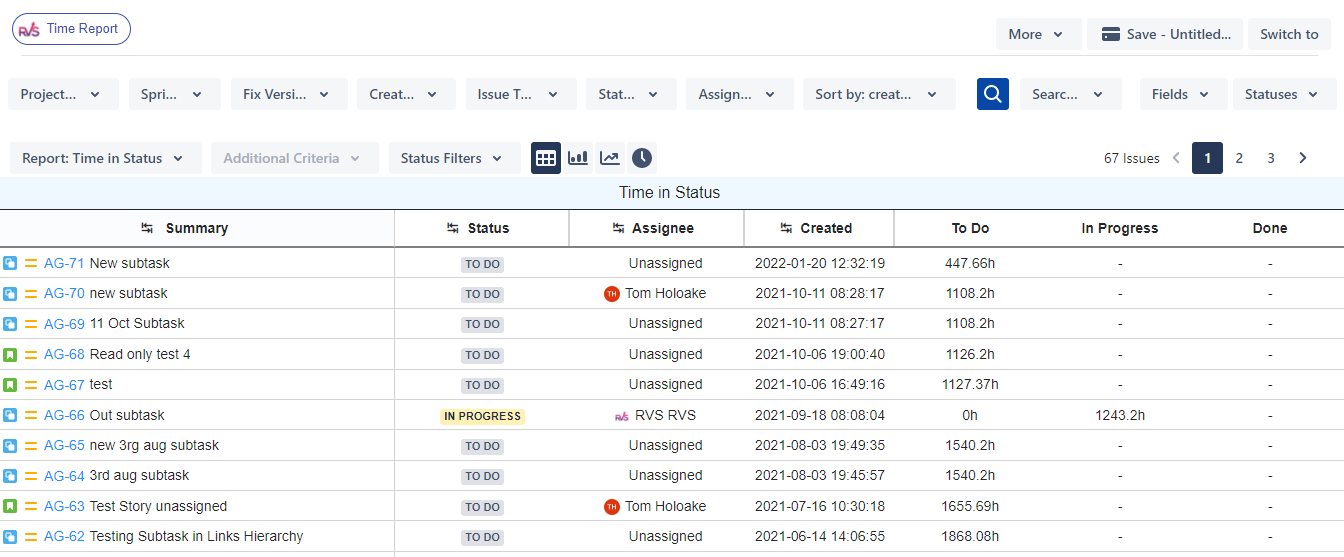
Track your bottleneck Issues. Identify the issues which are taking more time by tracking their time spent in each status and time spent with each assignee, and take appropriate actions, with more than 7 types of reports.
Worklogs Report
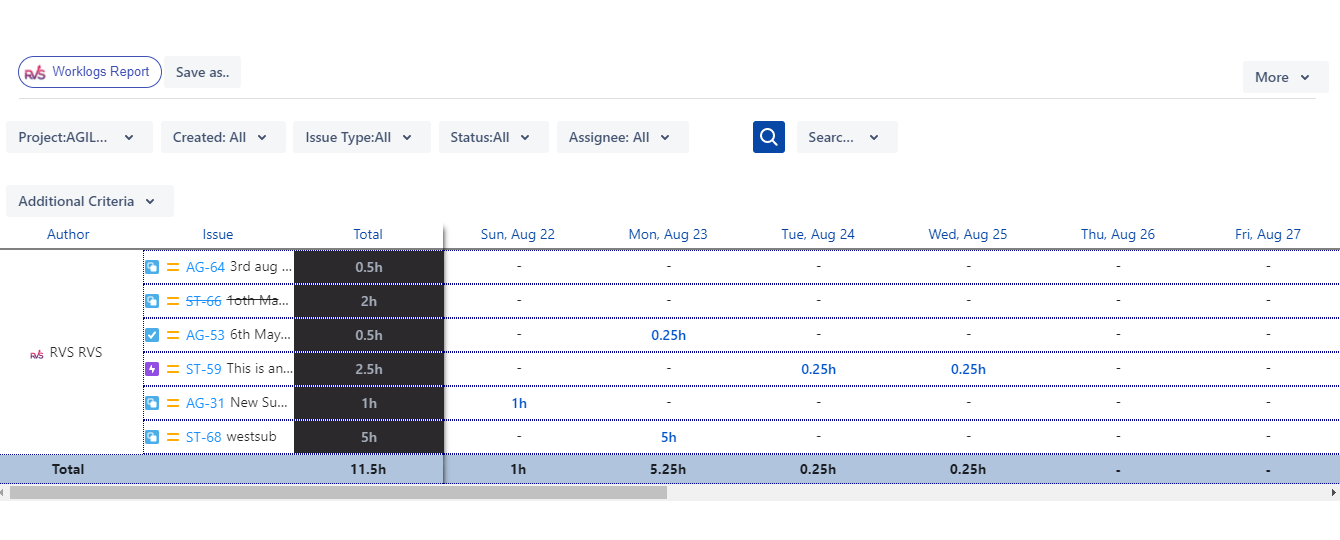
Worklog data within a specific date range for different projects. Group, categorize and filter the data.
Timesheet
Timesheet to view and enter time spent for all your issues for multiple days from a single place
Access Agile Tools
Cloud Edition :
Open “Apps” from your top Navigation bar. You will find Epic Hierarchy, Link Hierarchy, Time Reports, Worklogs report submenus. Please click as per you need.

Server / Data Center Edition :
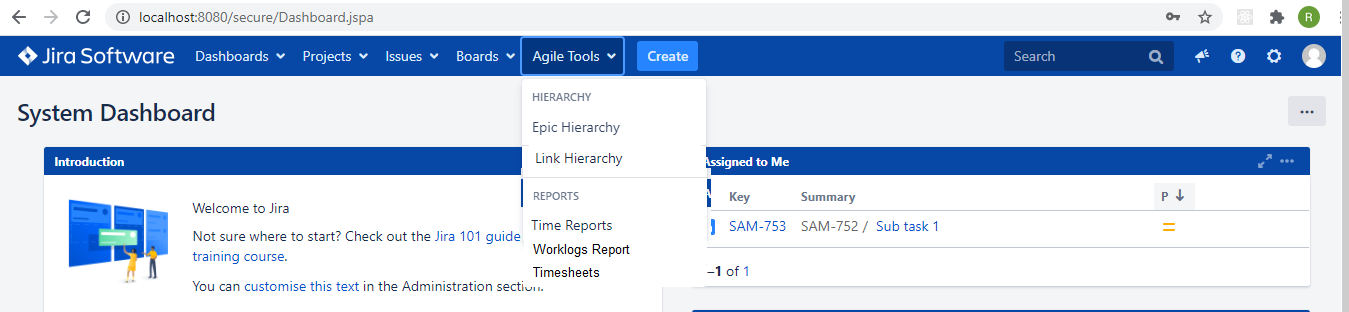
Open Agile Tools from your top navigation bar. You will find Epic Hierarchy, Time Reports submenus. Please click as per your need.
Epic Hierarchy
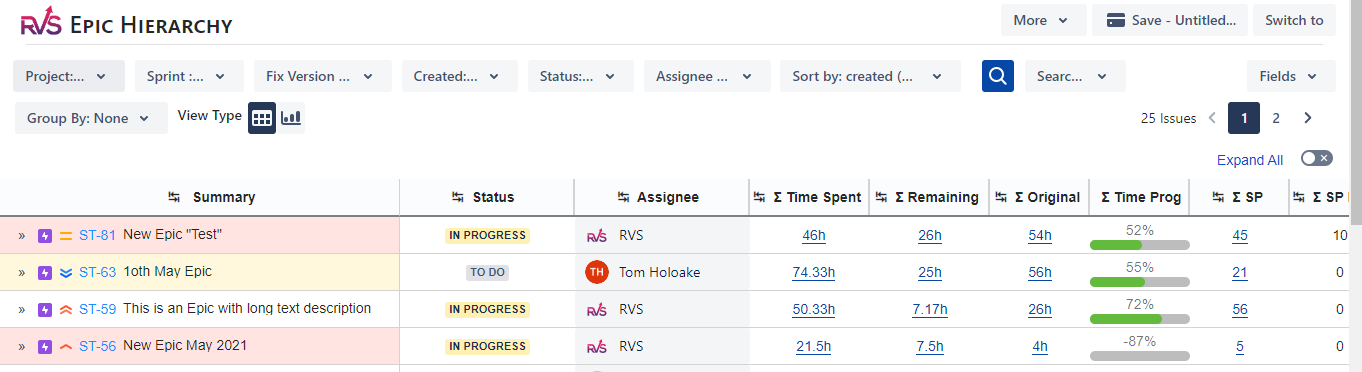
Clicking on “Epic Hierarchy” will navigate to the below screen. Select a Project from the drop down. Either click on “Search” button to load all the epics of the project or select a fix version/created date/status/assignee and load its details. The report will show rolled up estimates (time/story points progress) at epic level for all the issues in the epic.
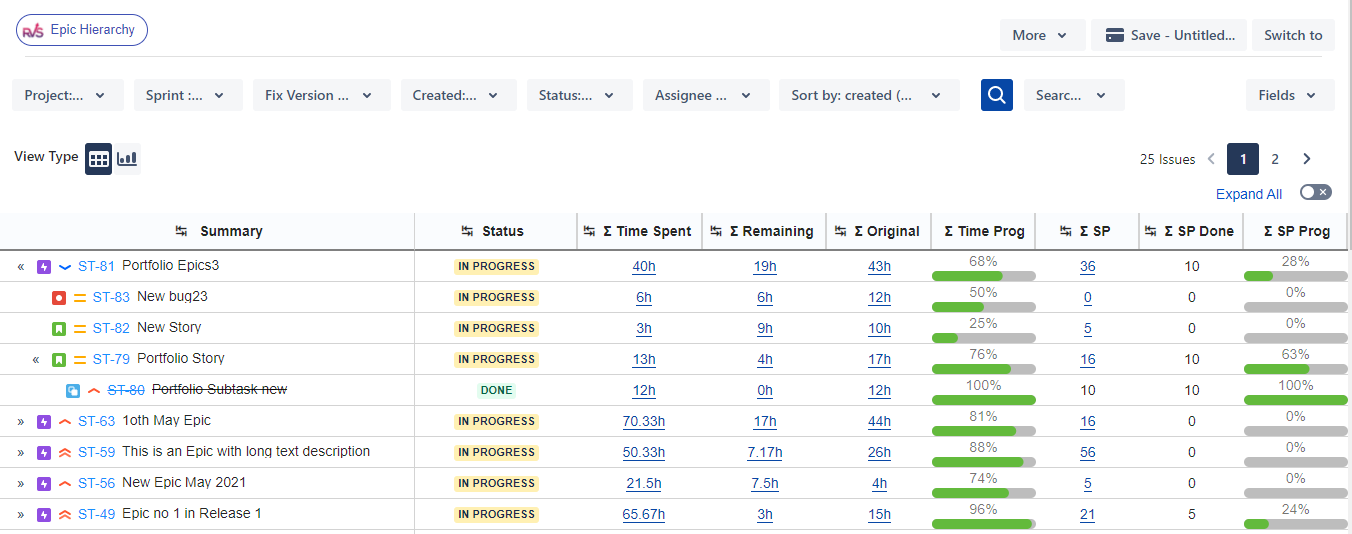
Edit Issue Summary, Status, Assignees, Estimates, Story points and lot more right on the Hierarchy report.
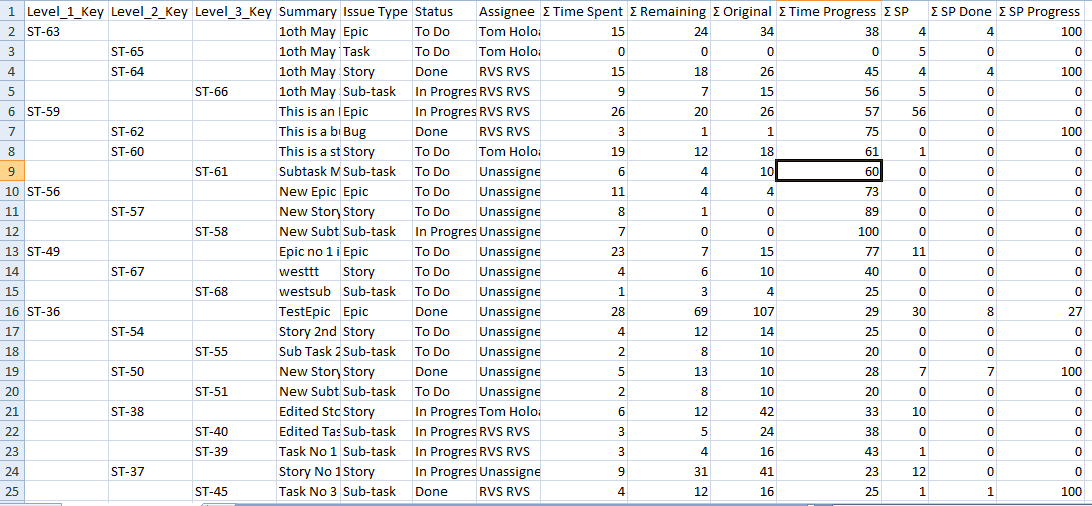
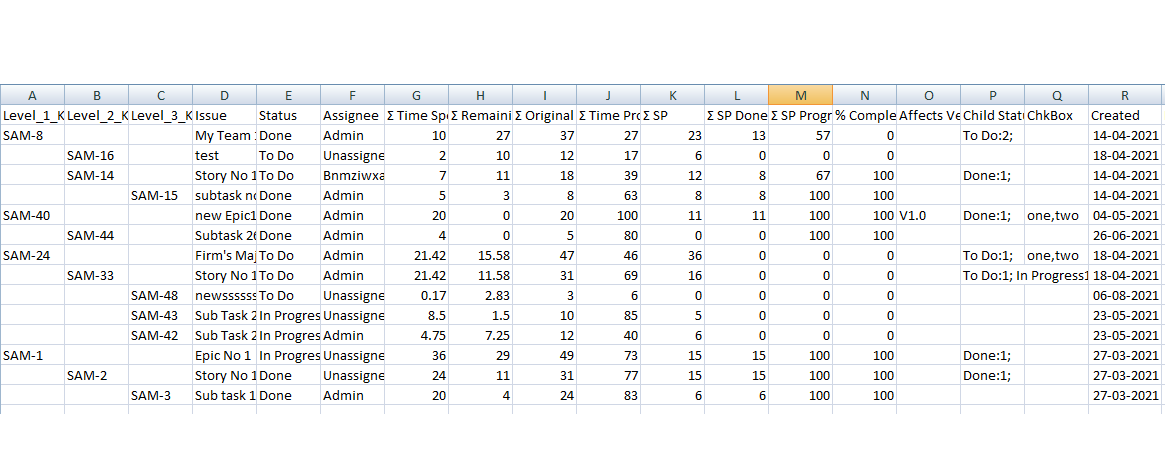
Export to Excel : Epic Hierarchy can be exported to Excel in CSV format by clicking on the Excel icon. The exported data shows complete hierarchy as in the screen shot below
How to view Portfolio/Advanced Roadmaps Hierarchy
Clicking on “Links Hierarchy” will navigate to the below screen. The Portfolio/Advanced Roadmaps Hierarchy too can be visualized and tracked on this screen. For that you need to select your top level issue type, eg Initiative, from the “Issue Type” filter and select “Include Jira Hierarchy” from the additional search box.
Epic Hierarchy on Issue Screen
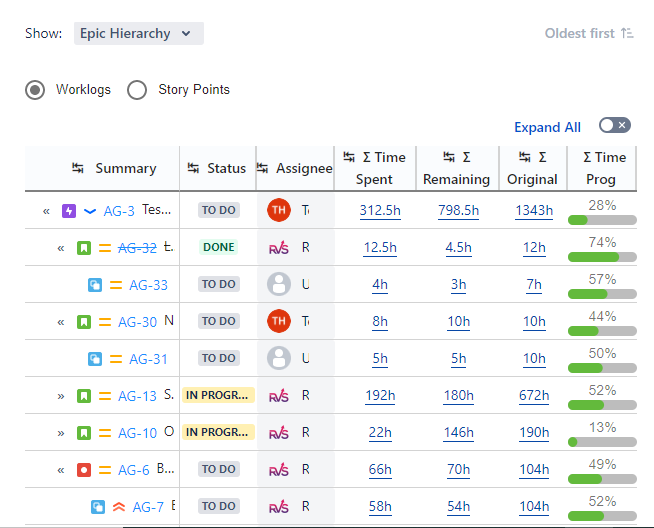
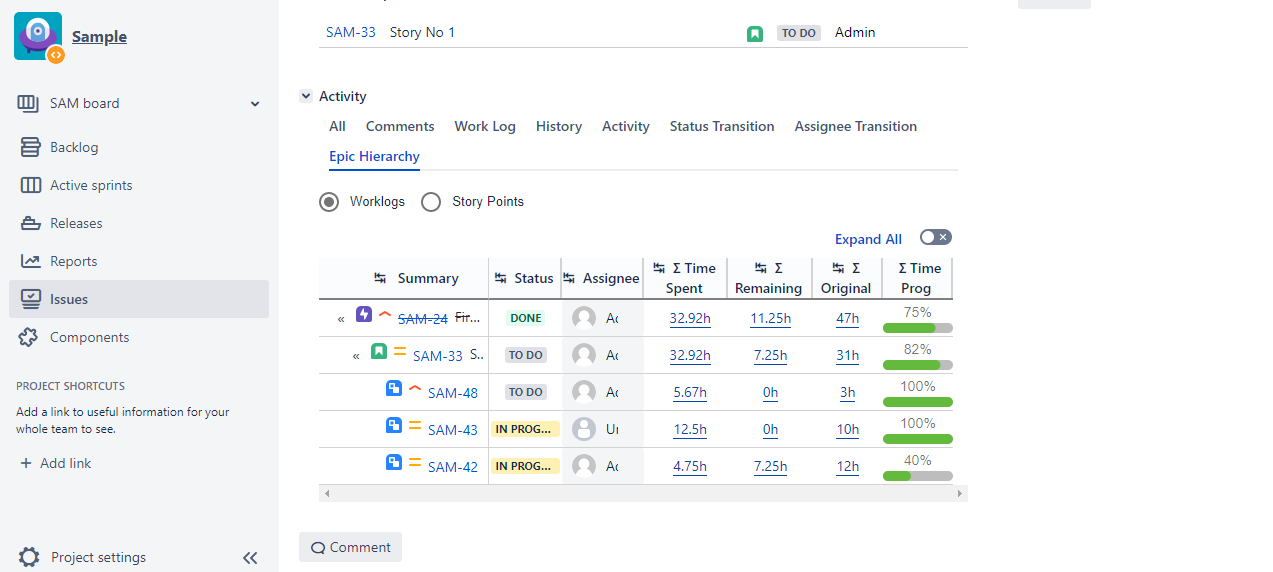
Epic Hierarchy can be viewed on Issue Screen as well. The hierarchy shown will be for the current Epic.
All the key fields are editable on this screen as well.
Cloud Edition : On Cloud the Epic Hierarchy is visible as a dropdown on the Activity section as shown below.
Server Edition : On Server the Epic Hierarchy is visible as a tab on the Activity section as shown below.
Links Hierarchy
Clicking on “Links Hierarchy” will navigate to the below screen. Select a Project from the drop down. Either click on “Search” button to load all the links of the project or select a fix version/created date/issue type/status/assignee and load its details. You can also specify the Issue link and from Additional search criteria you can filter results based on max depth, child issue types and whether to include subtasks in the hierarchy.
Links Hierarchy also has an option to include your standard Jira Hierarchy (Epic → Story → Subtask) in the sum up calculations. You need to select the checkbox “Include Jira Hierarchy” as shown below.
Also the app allows to view the Portfolio/Advanced Roadmaps Hierarchy too. For that you need to select your top level issue type, eg Initiative, from the “Issue Type” filter and select “Include Jira Hierarchy” from the additional search box.
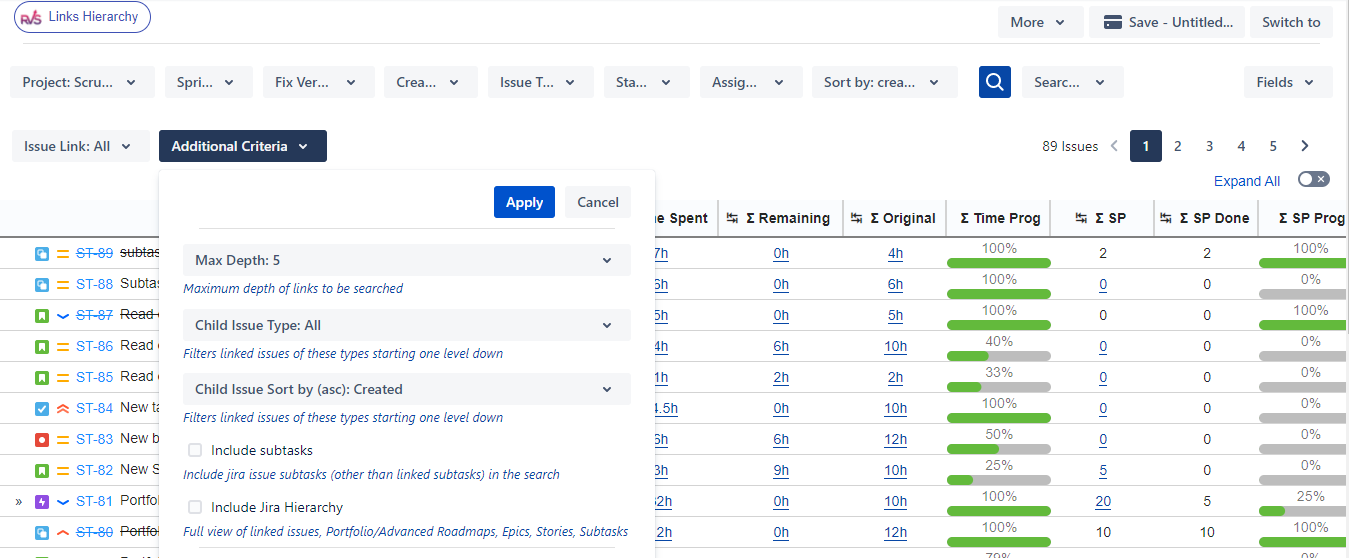
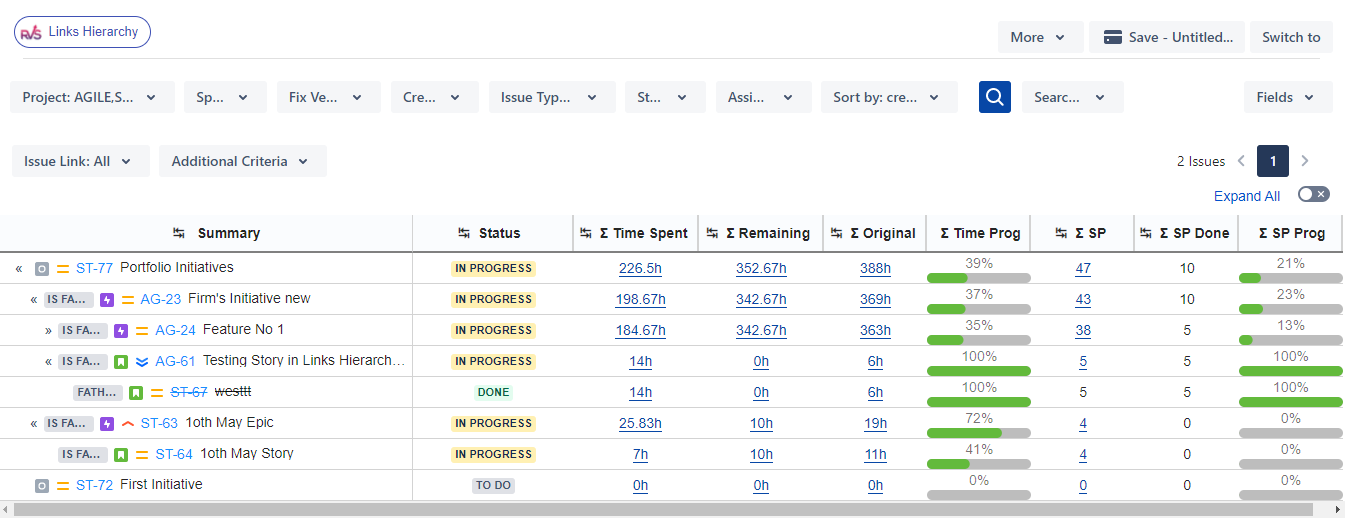
The report will show rolled up estimates (time/story points progress) at top level for all the issues linked inside.
Edit Issue Summary, Status, Assignees, Estimates or Story points right on the Hierarchy report.
Summary Reports
You can view a quick summary of your projects using Summary Reports option on the Hierarchy Screens and Time in Status screen as well. This feature also allows to slice and dice your data using JQL and get a bird’s eye view of the progress.
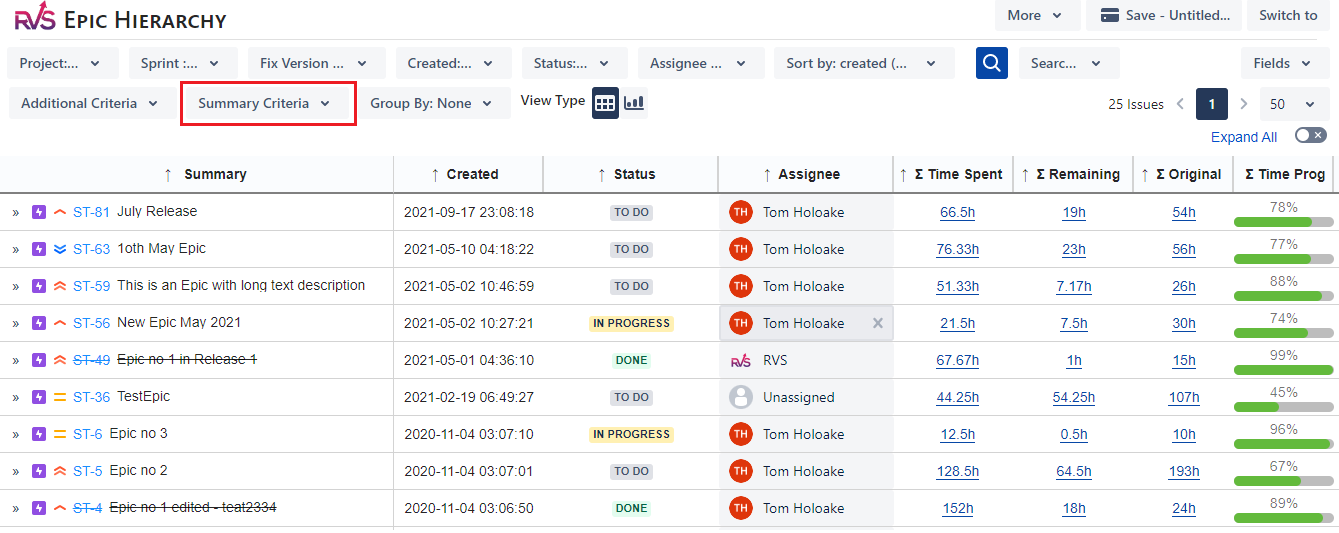
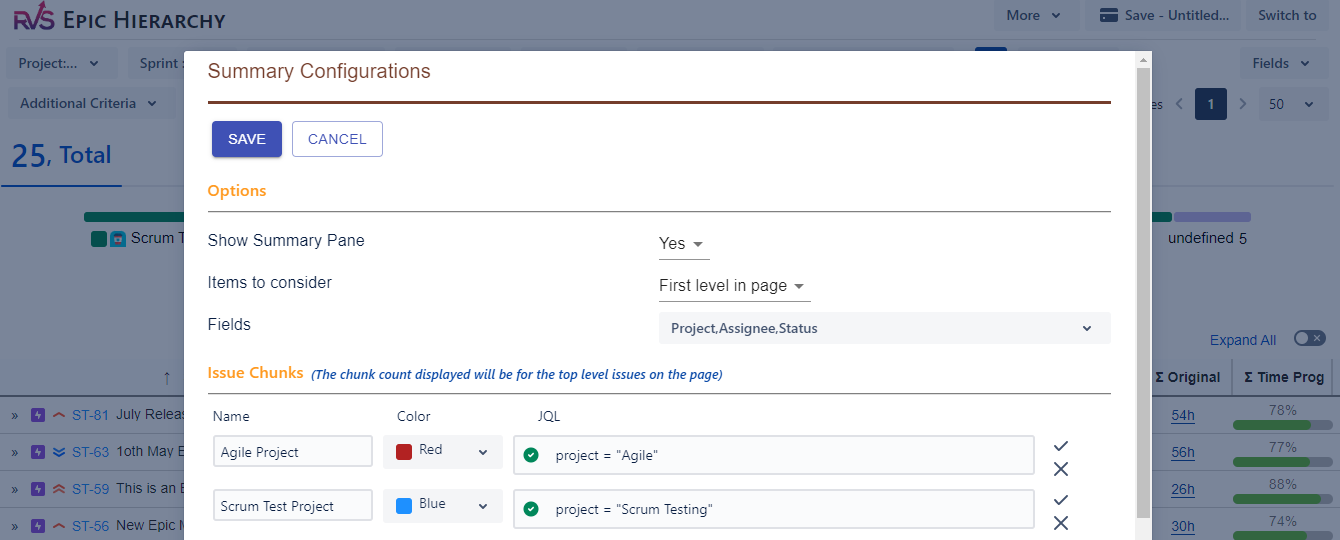
Clicking on the “Summary Criteria” drop down will open a popup as shown below.
In the example below I have set :
Show Summary Pane = “Yes”
Consider Items only at 1st Level in hierarchy
Added the Fields Project. Assignee and Status
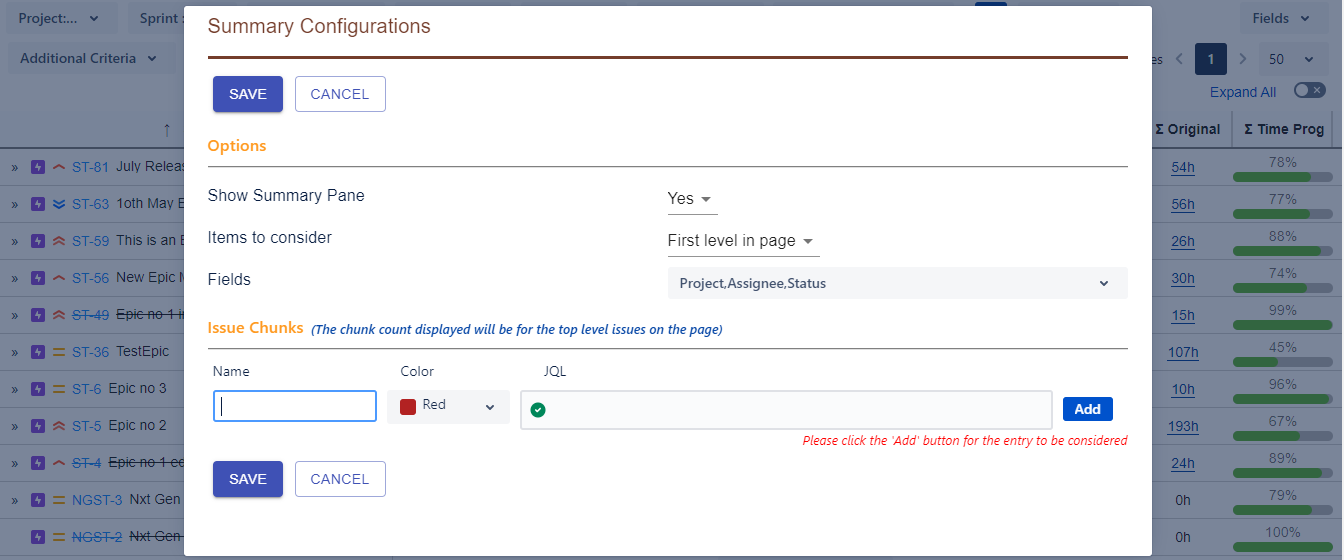
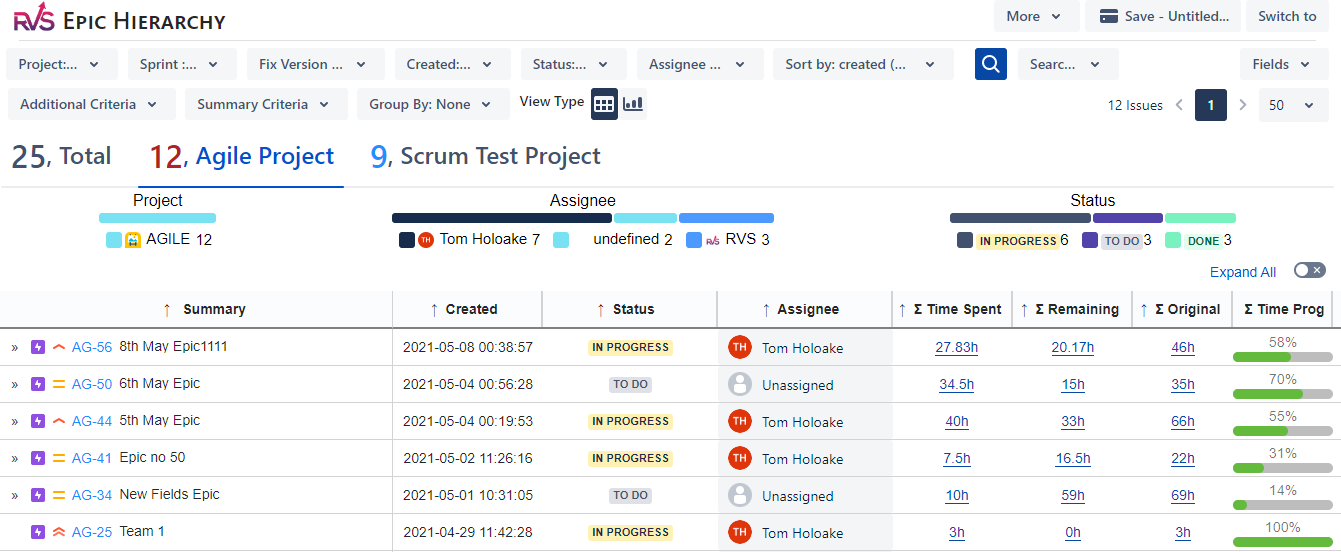
Based on above settings, the app will show summary bars as below.
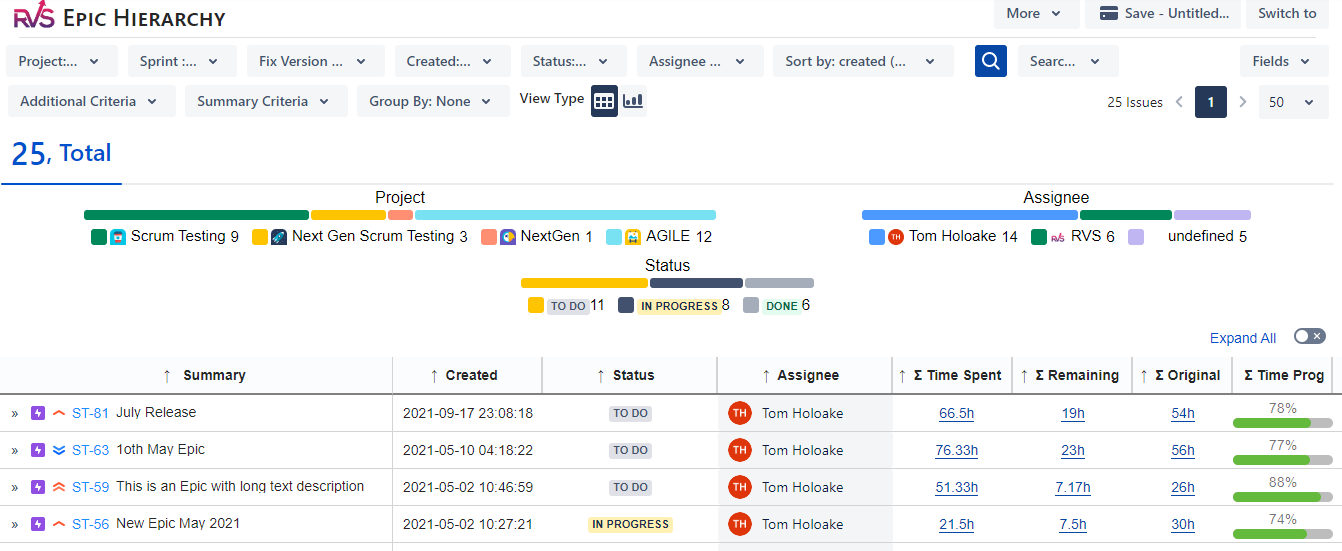
You can also create your own issue chunks by specifying your custom JQL to further slice and dice your data.
In the example below, I have created 2 issues chunks for filtering by Projects in the JQL option.
Saving this configuration, will create 2 tabs.
How are Story Points Done calculated?
The story points done are automatically calculated based on the status of the story .
That is if the status of a story = 'Done'
then
Story points done = Story points total
Else
Story points done = 0
How to View Custom Fields Roll Up
Agile Tools provides the option to view Roll Up / Sum Up, up to Parent Level, of your Number Custom Fields.
To view the same, please edit your displayed columns on the hierarchy screens.
Agile Tools will add a Sum Up Column for each of your number custom field and show up the Roll up value at the parent level.
Edit story points
By Default the “Story Points total” are editable only on a user story level and are not considered for sum up at top level. If you need the Story points entered at task level to be considered for sum up at top level, please select the “Consider issues other than Story” to “Yes” in Agile Tools Settings screen. The “Story points done” are automatically calculated based on the status of the story/task i.e
That is if the status of a story = 'Done'
then
Story points done = Story points total
Else
Story points done = 0
Also, once the story is marked 'Done' editing is dis-allowed
View Time Reports (Time in Status)
Clicking on “Time Reports” will navigate to the below screen. Select the Project, Fix Version and From/To Dates, along with the report type to view
Agile Tools provides multiple Time in Status Reports to track your Issue as per below list. It also provides
Export to Excel : All the reports provide the facility to Export to Excel. The Time values in reports are exported by default in Hours only to Excel
Settings : The time value in reports can be changed in Settings screen. They can be seen in Hours/Days & Jira default format
Statuses: You can define which statuses or grouped statuses you want to view on the report, by clicking on Statuses drop down on the right of the screen.
Additional Criteria : This option is enabled when you want to view “Time in Status Per Time Grain” or “Time with Assignee Per Time Grain” reports.
Reports:
Time in Status - Total time, the issue was in each of your Status
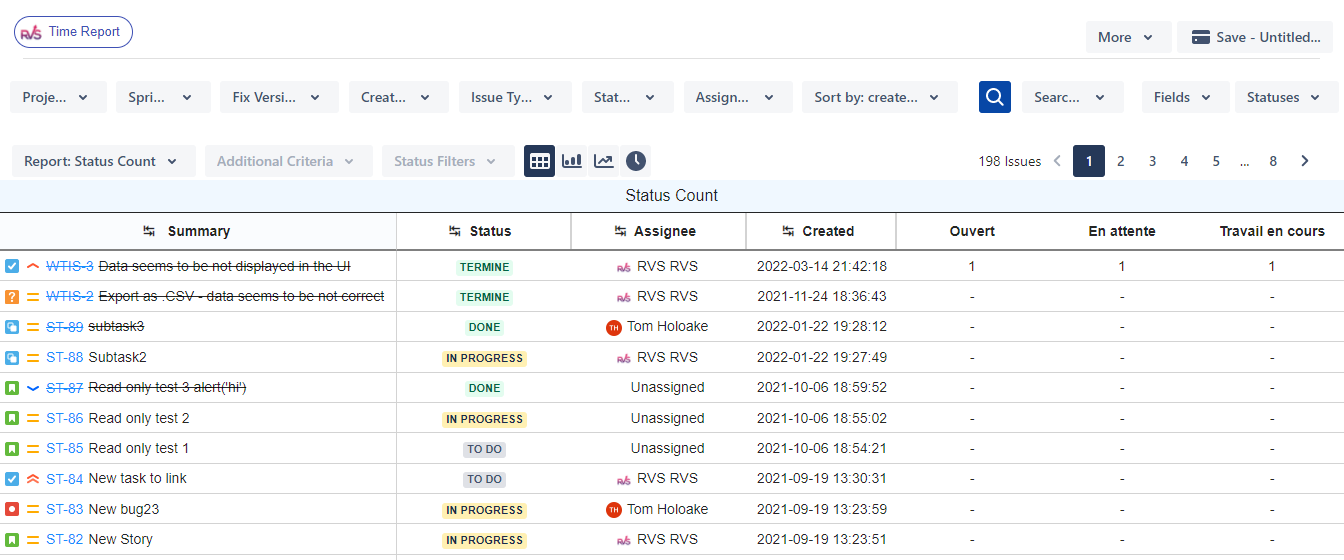
Time in Status Count - Number of times, the issue was in each Status
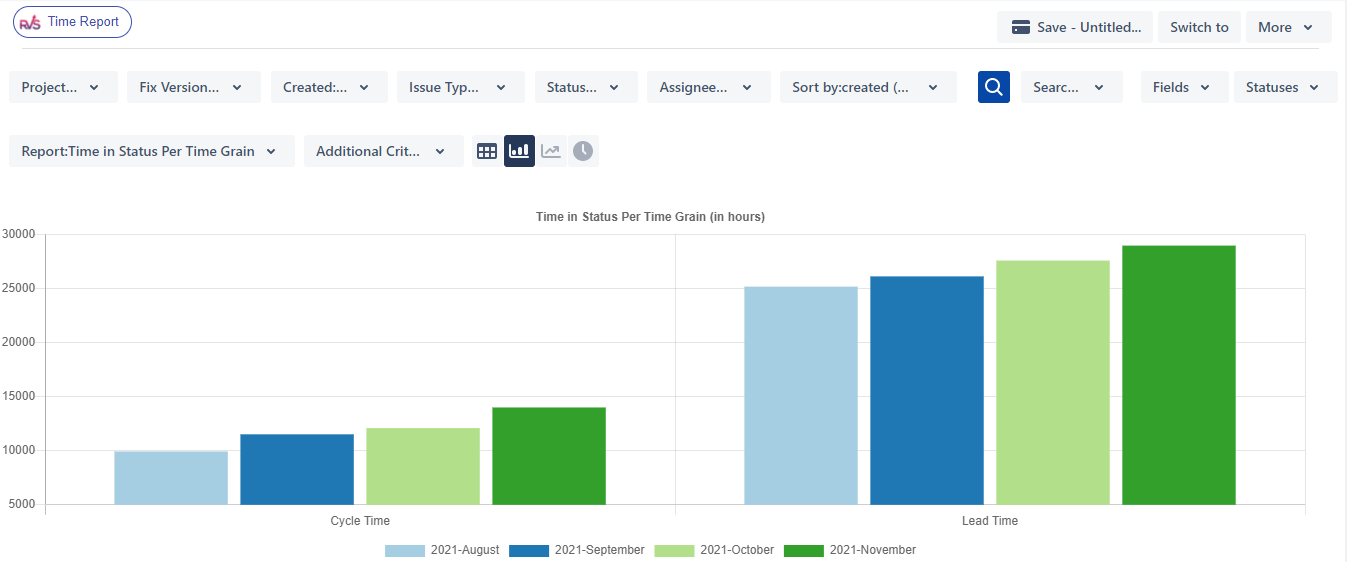
Time in Status Per Time Grain - You can compare status times over a historic duration and take actions if the time in status are not improving.
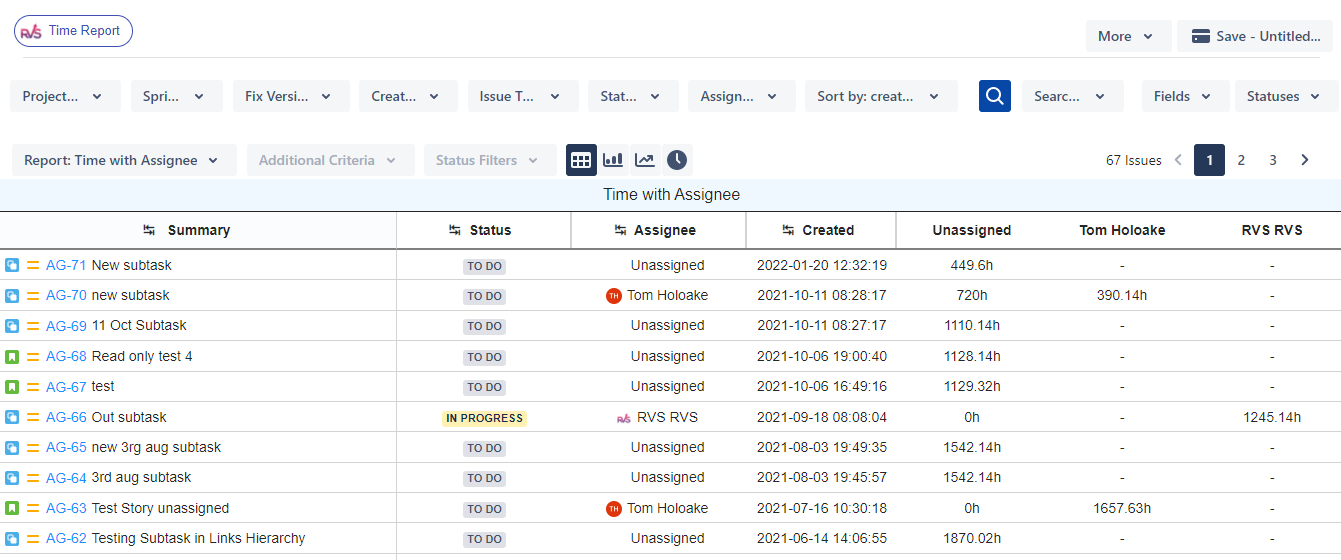
Time with Assignee - Total time, the issue was with each Assignee
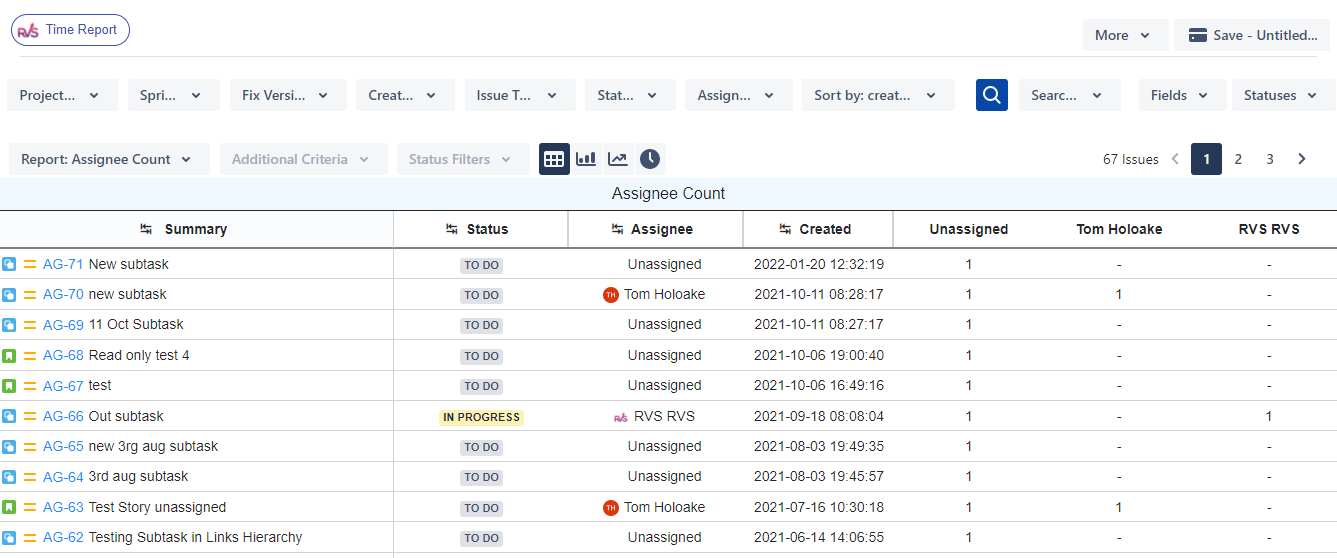
Time with Assignee Count - Number of times, issue was with each Assignee
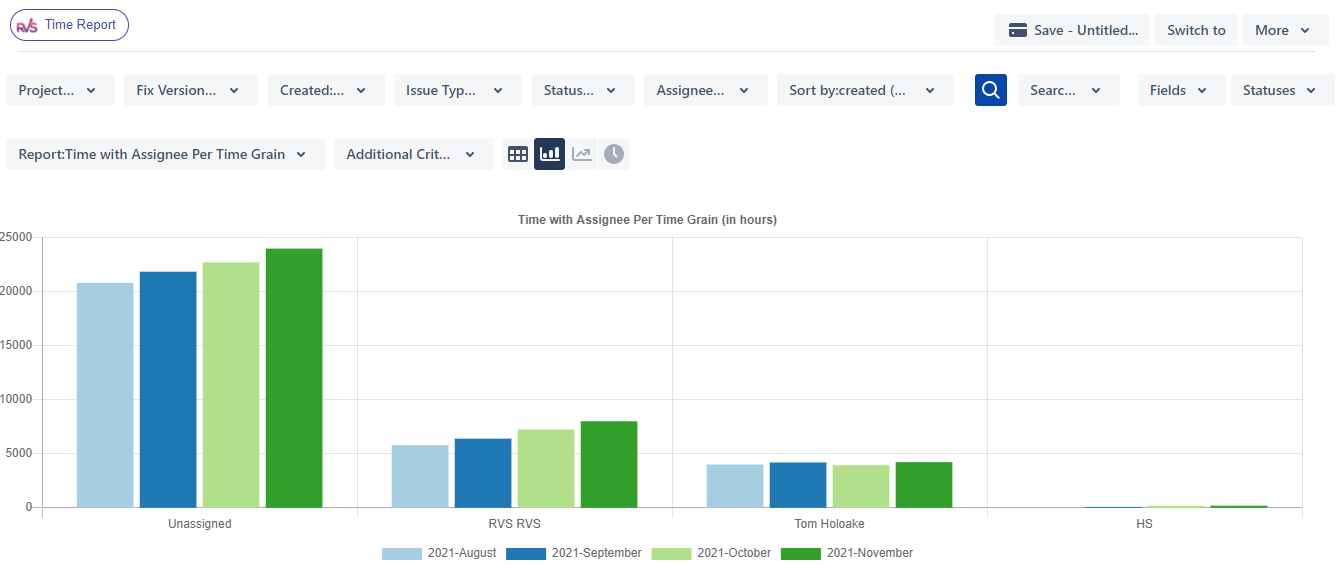
Timewith Assignee Per Time Grain - You can compare status times over a historic duration and take actions if the time with assignee is not improving.
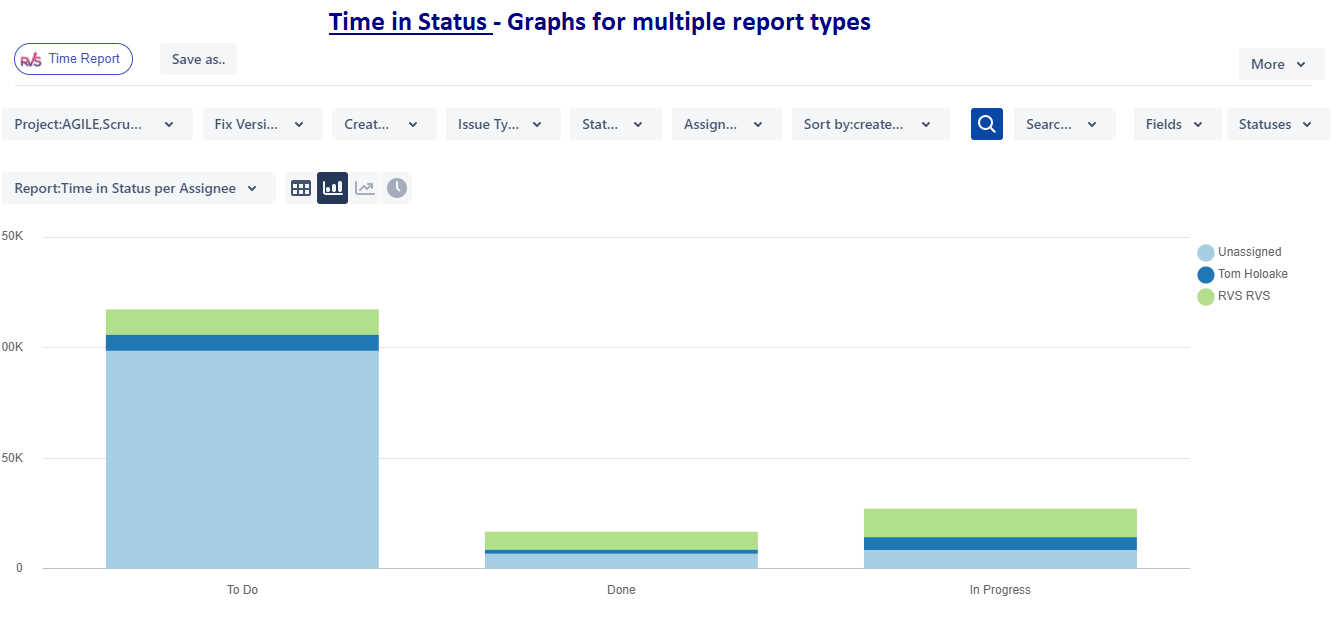
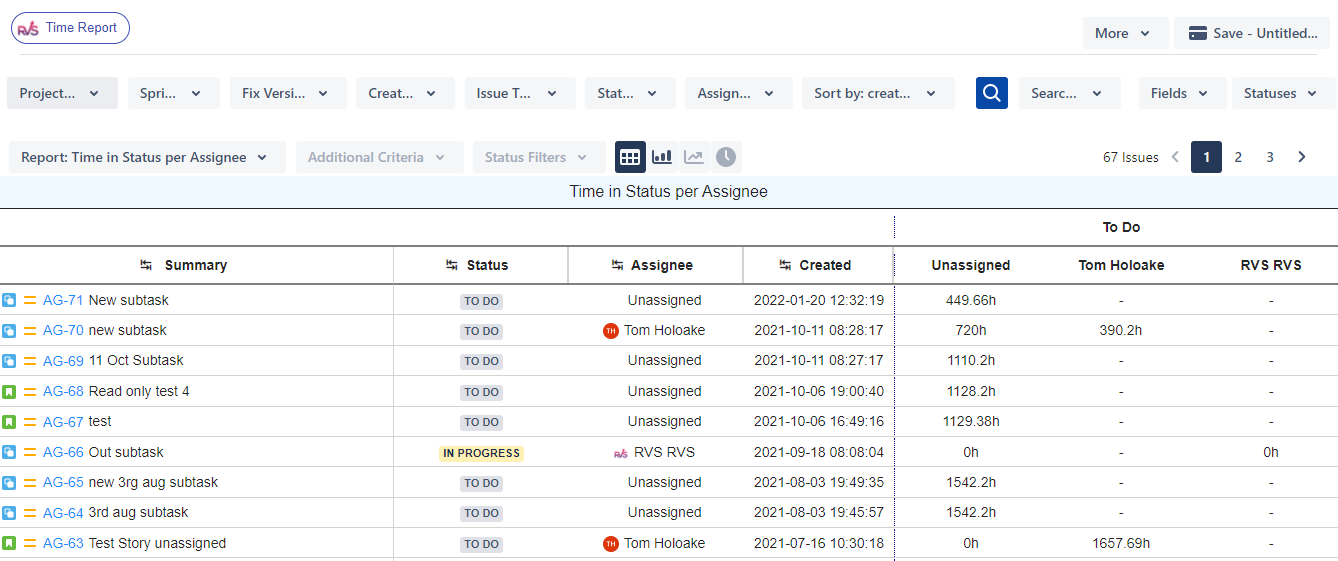
Time in Status per Assignee - Total time, the issue was in each Status with Assignee
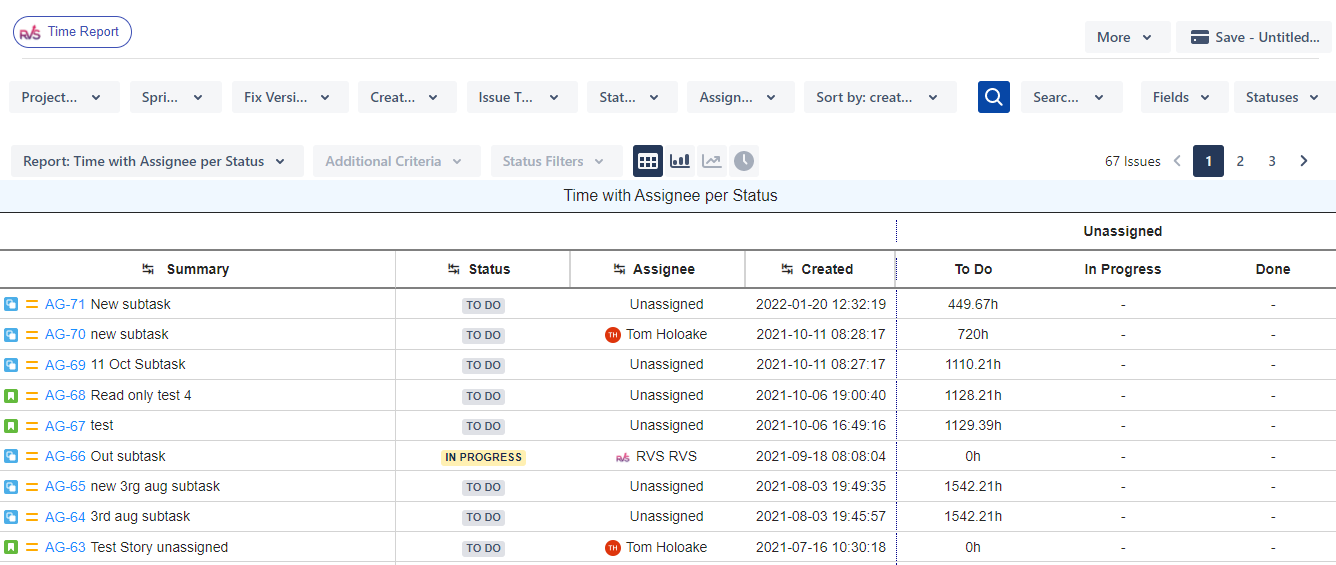
Time with Assignee per Status - Total time, the issue was with Assignee per Status
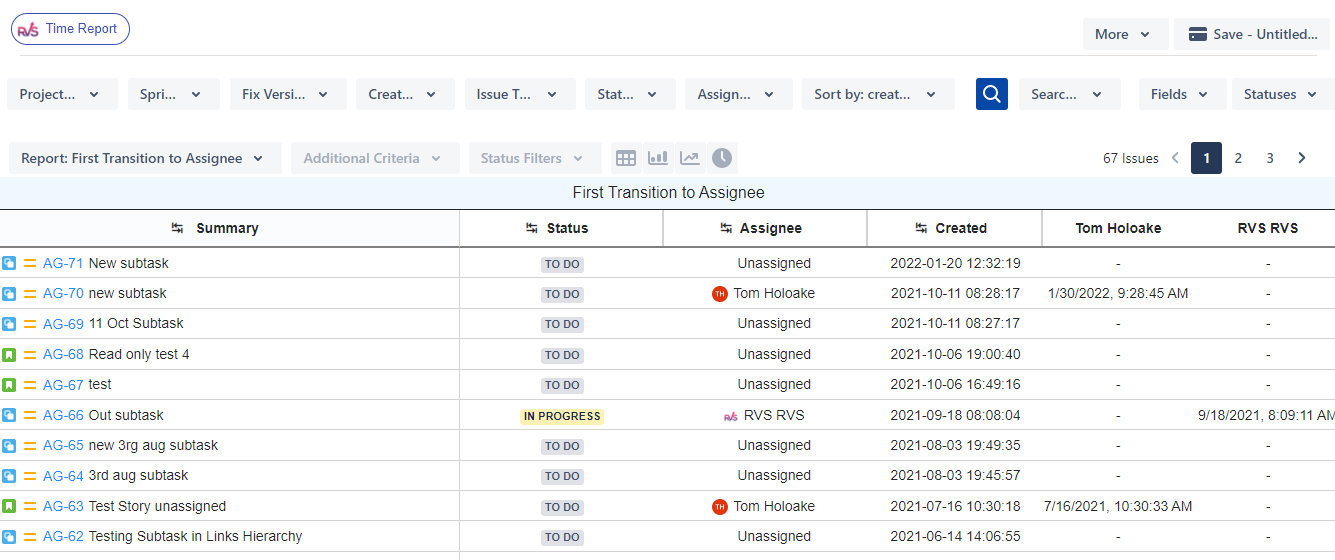
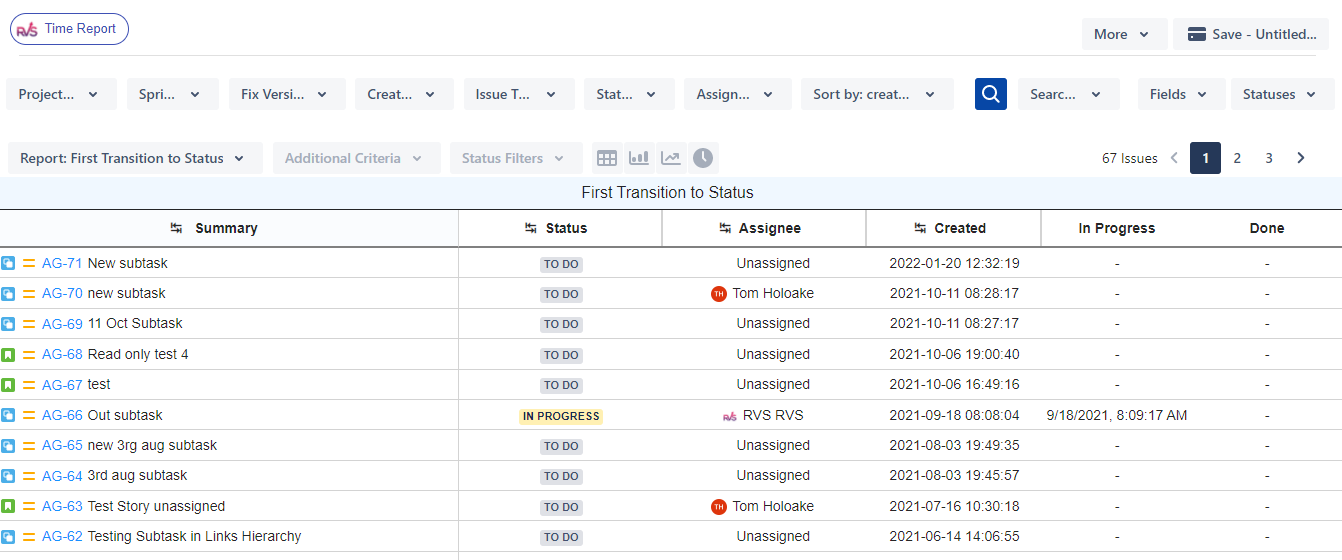
Transition Reports : Multiple Transition Reports
Status Transition Count
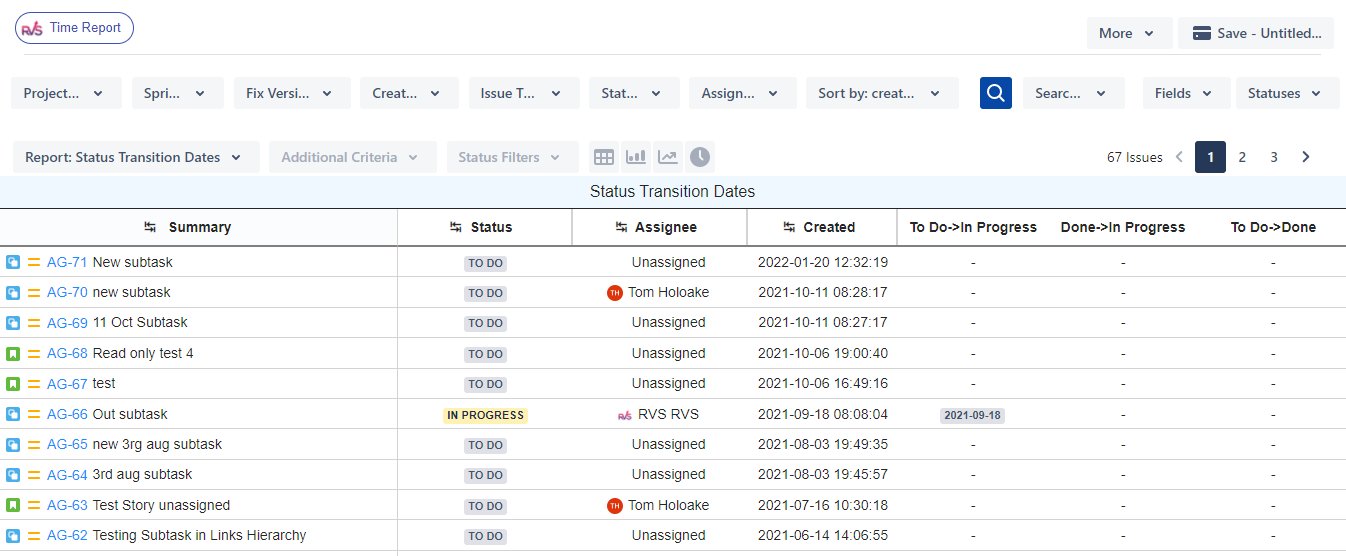
Status Transition Dates
First Transition To Assignee
Last Transition to Assignee
First Transition to Status
Last Transition to Status
First Transition from Assignee
Last Transition from Assignee
First Transition from Status
Last Transition from Status
Check time in status of an issue
Agile Tools helps to view complete transitions of an issue with addition of following tabs on the issue screen
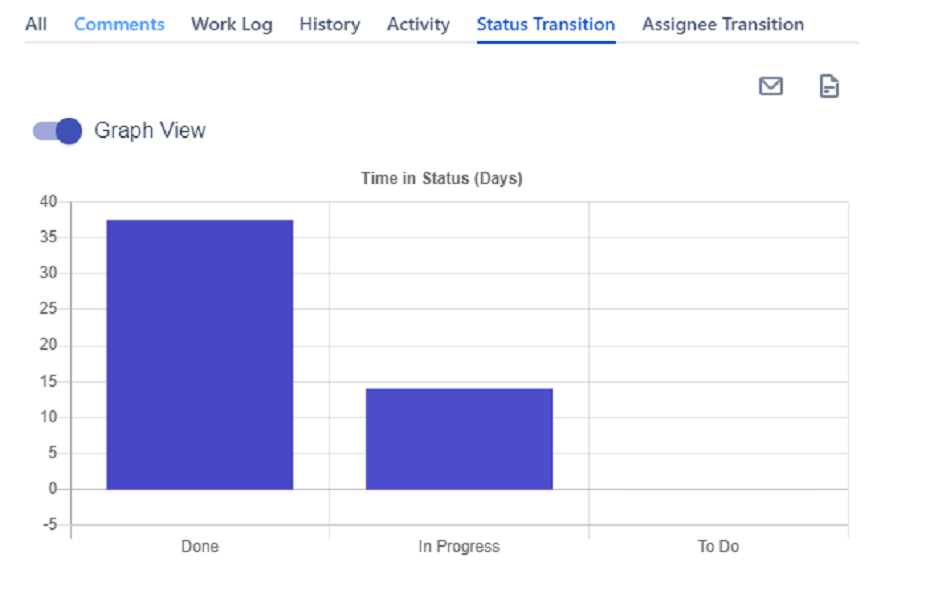
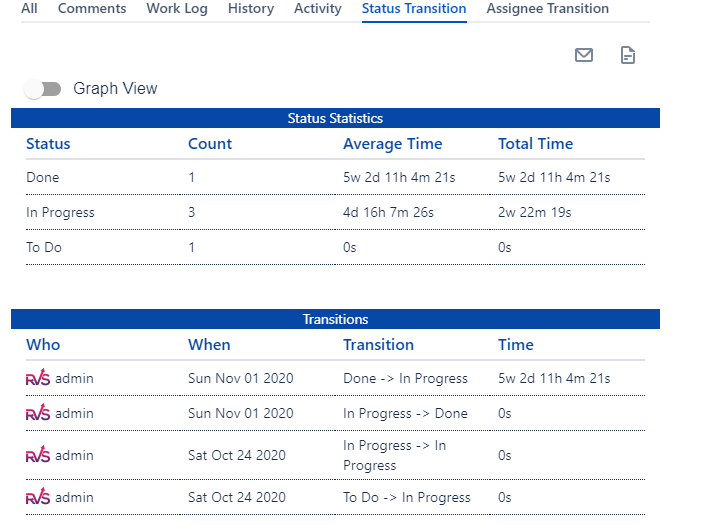
· Status Transition : View all the status changes in a single tab along with average time and count in each status. Switch between graphical and tabular view to make more out of the data.
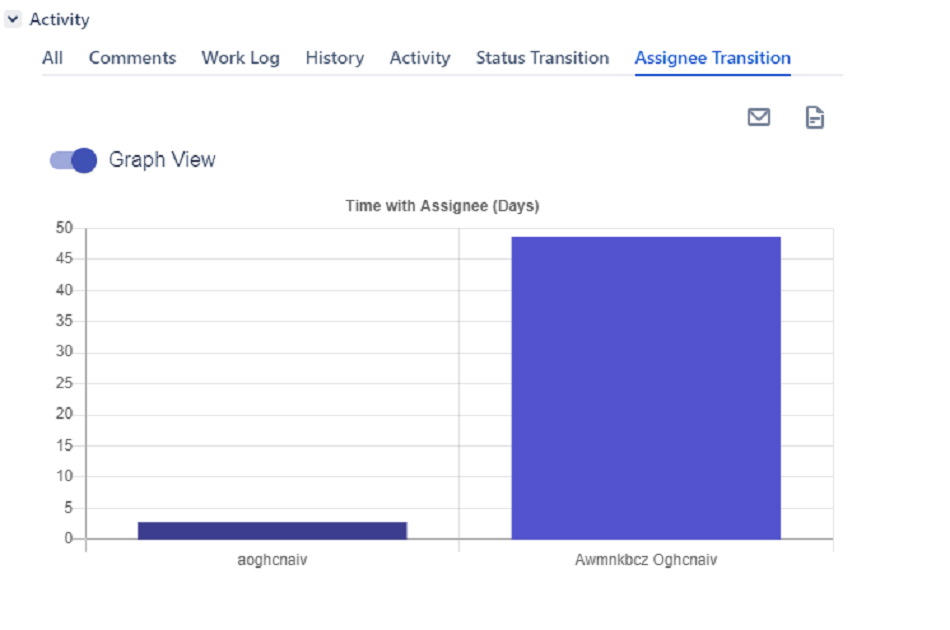
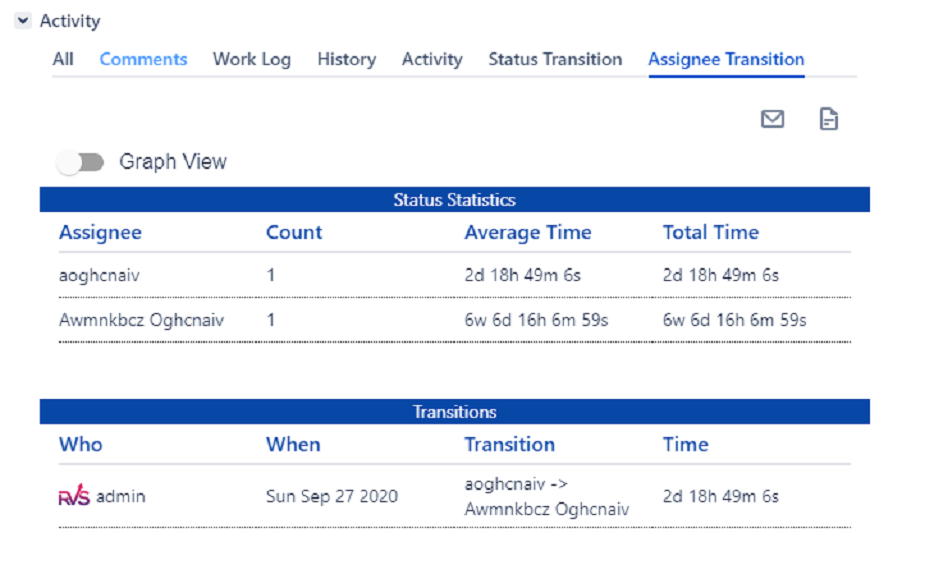
· Assignee Transition : View all the assignees for the issue along with the time for which the issue was with each assignee. Switch between graphical and tabular view to make more out of the data.
·
Worklogs Report
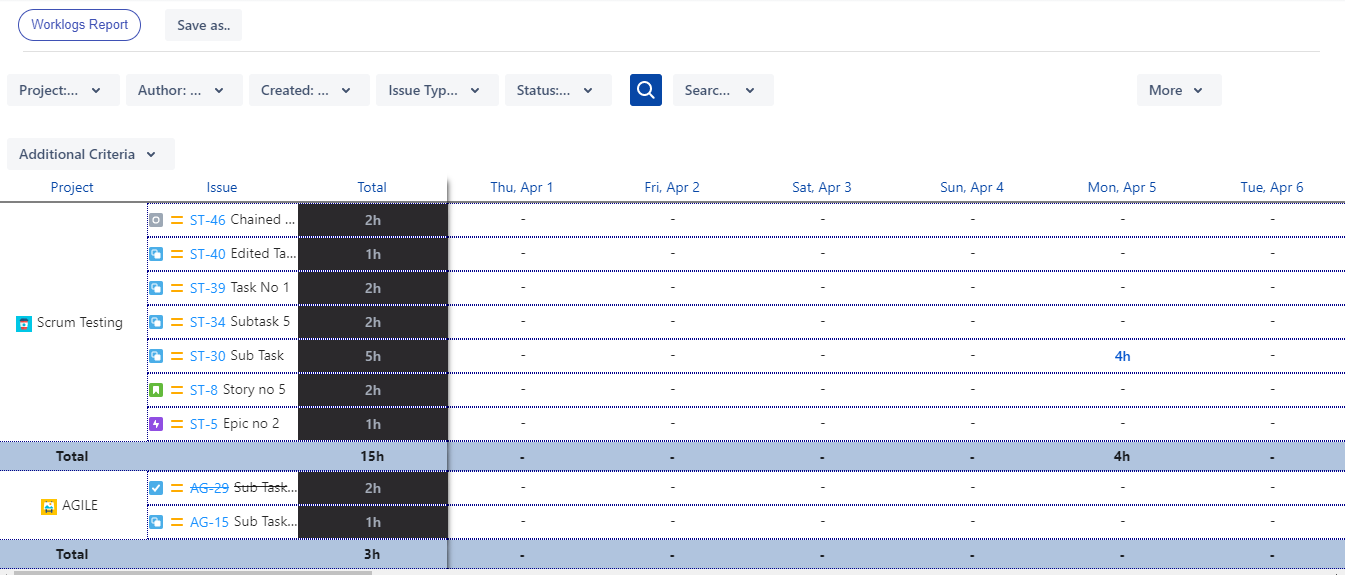
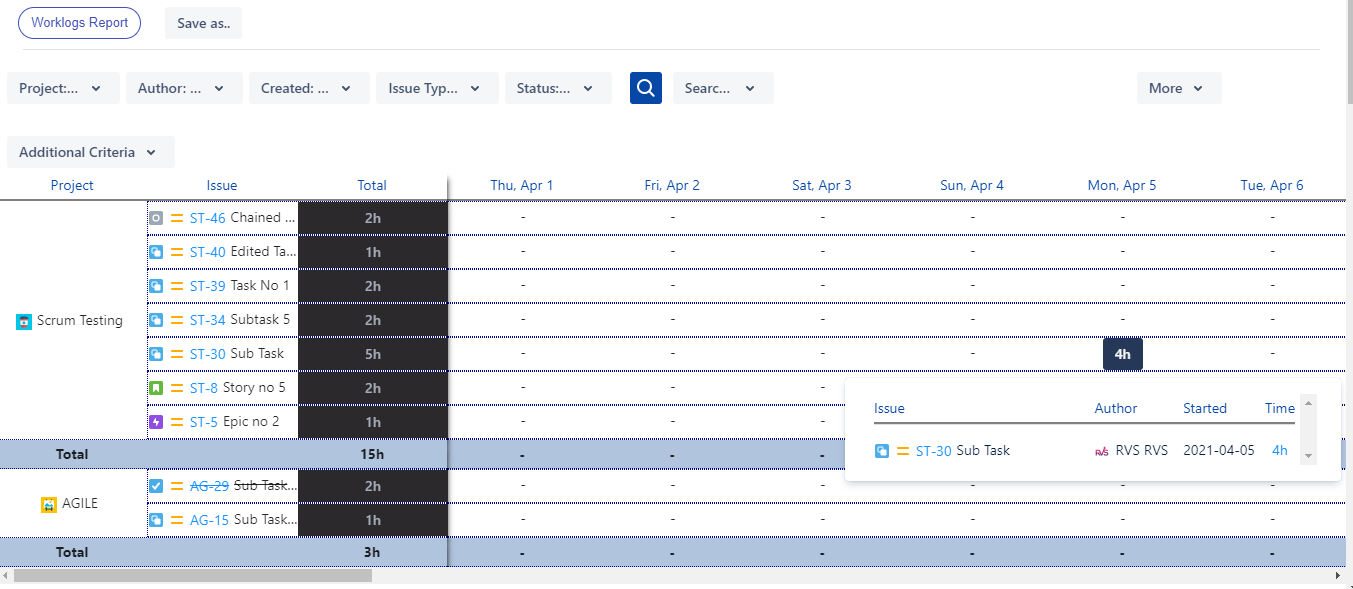
Clicking on “Worklogs Reports” will navigate to the below screen. Select the Project/Issue created Dates/Issues Type/Status to view the report.
Additional Filter Criteria provides the options to select Worklogs Created Date range/Period Grouping/Category/Group By
Export to Excel : The report provides the facility to Export to Excel. The Time values in report are exported by default in Hours only to Excel
Settings : The time value in reports can be changed in Settings screen. They can be seen in Hours/Days & Jira default format
Timesheets
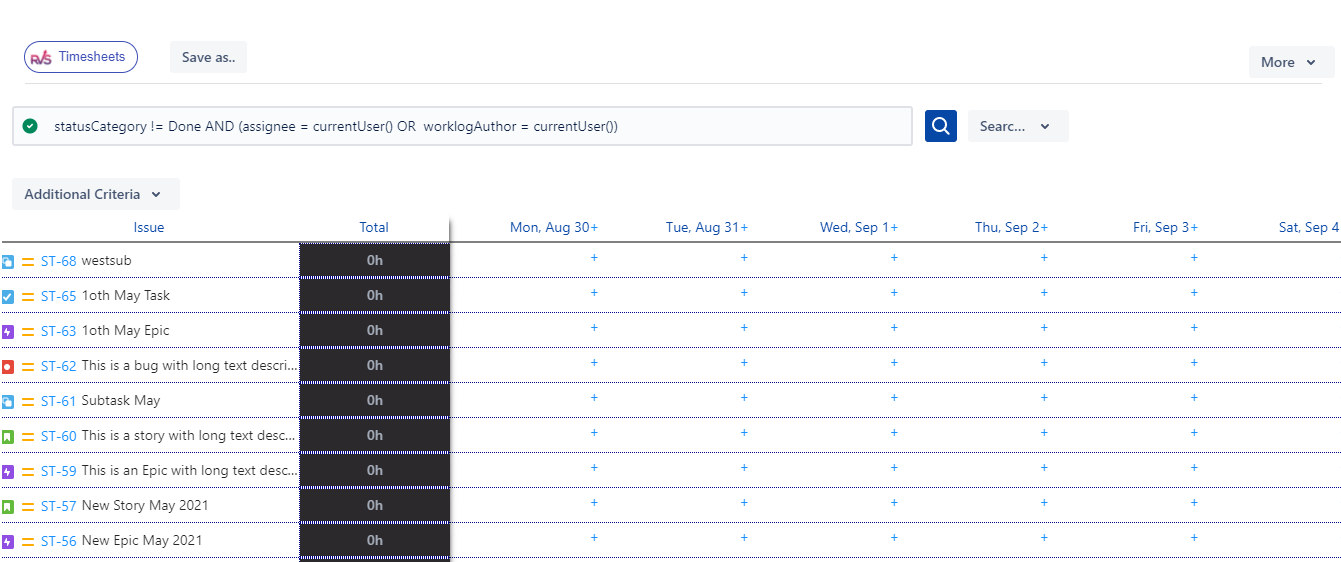
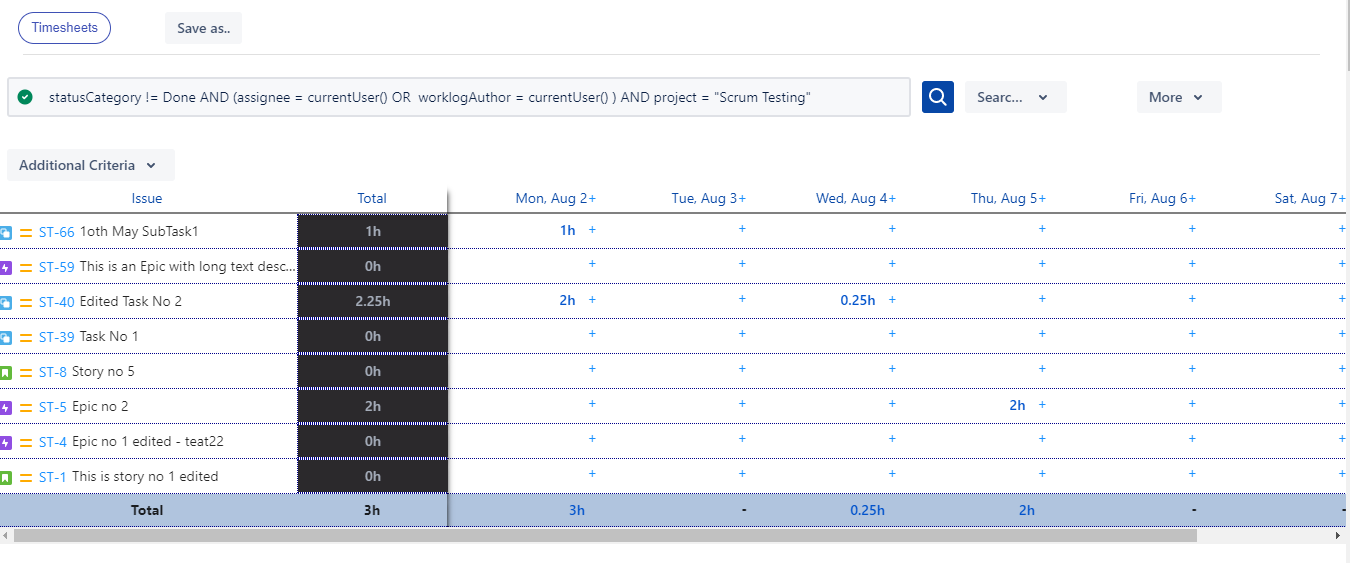
By default the Timesheets reports open with list of issues where current users is the author or assignee and issue status is not done
Clicking on “Timesheets” will navigate to the below screen.
Additional Filter Criteria provides the options to select Worklogs Created Date range
Export to Excel : The report provides the facility to Export to Excel. The Time values in report are exported by default in Hours only to Excel
Settings : The time value in reports can be changed in Settings screen. They can be seen in Hours/Days & Jira default format
Which issues Timesheets shows
By default, Timesheets lists issues that are not Done and where you are the assignee or have logged work:
statusCategory != Done AND (assignee = currentUser() OR worklogAuthor = currentUser())
Time logged on issues that are already Done is not shown with this default. To include it, a Jira admin can change the query in Apps > Agile Tools > Settings > Default JQL (global settings). For example:
assignee = currentUser() OR worklogAuthor = currentUser()
Users see this field read-only in their own settings. Any user can also type a different JQL in the Timesheets search and save it as a report.
Dashboard Gadgets
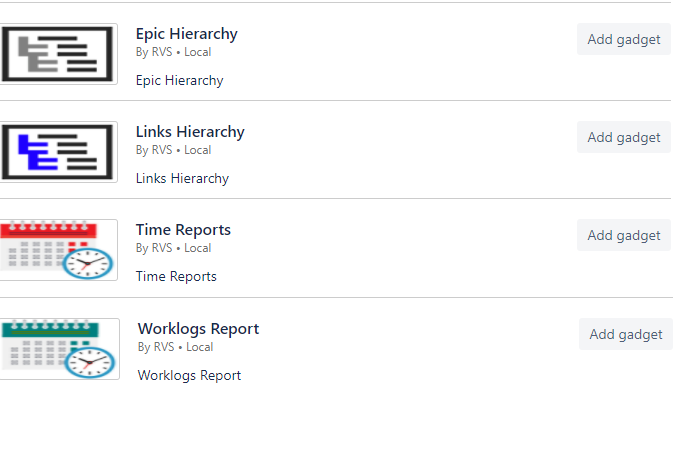
Agile Tools gadgets can be added on Dashboards by clicking on Dashboards → <Your Dashboard Name> → Add Gadget. In the “Add a Gadget PopUp”, search for Votazz and it will show all the available gadgets which can be added.
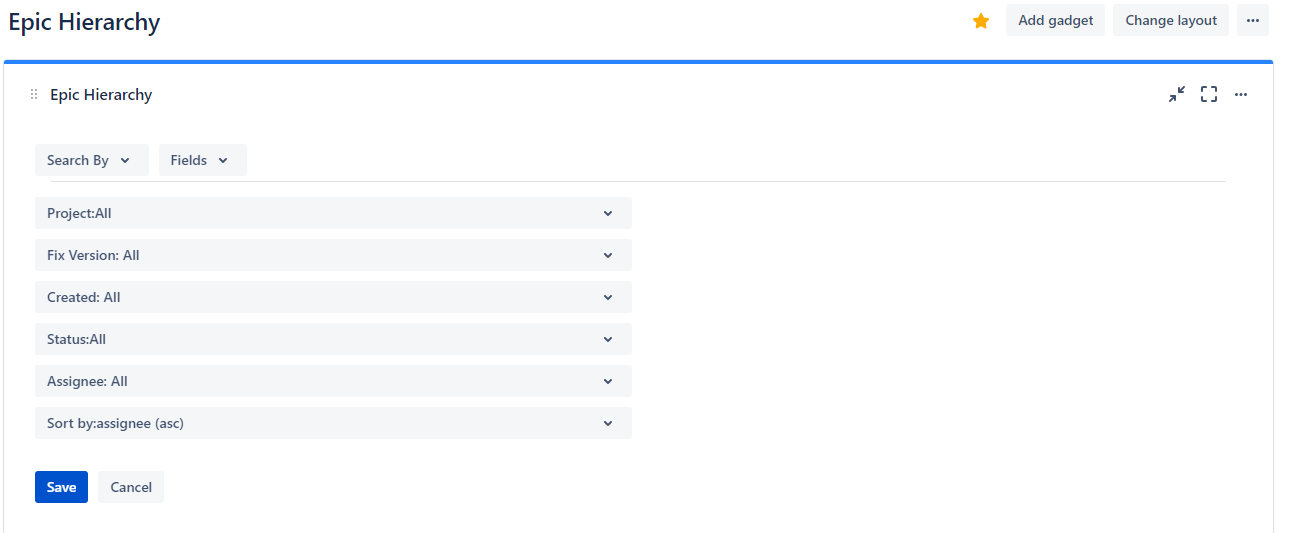
Epic Hierarchy Gadget Configuration
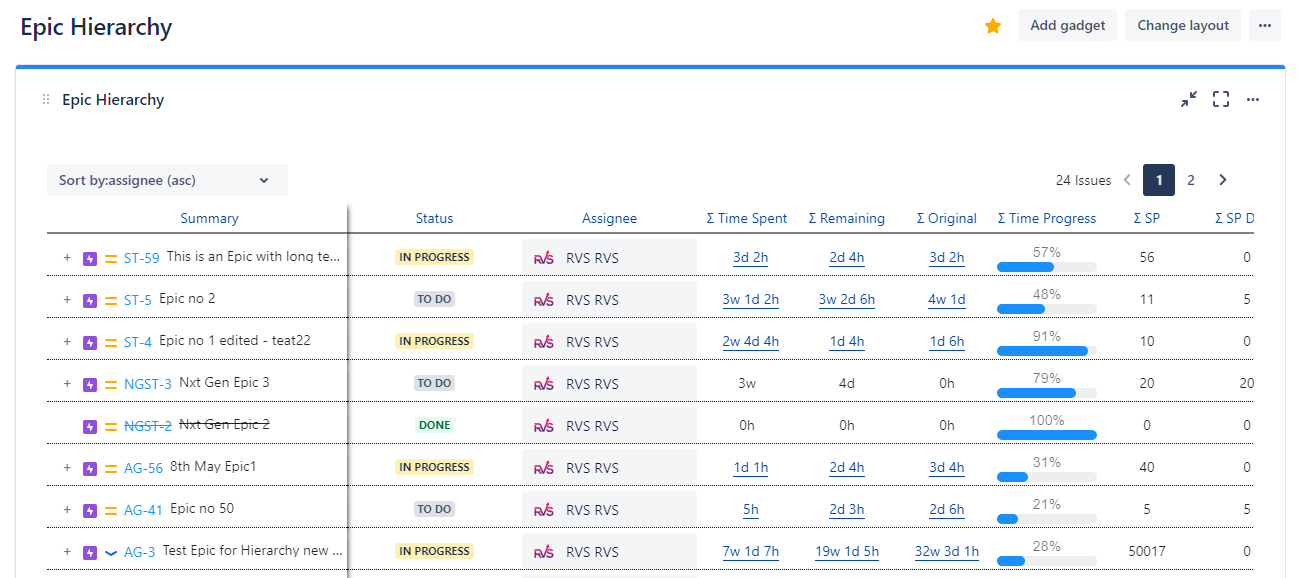
Epic Hierarchy Gadget
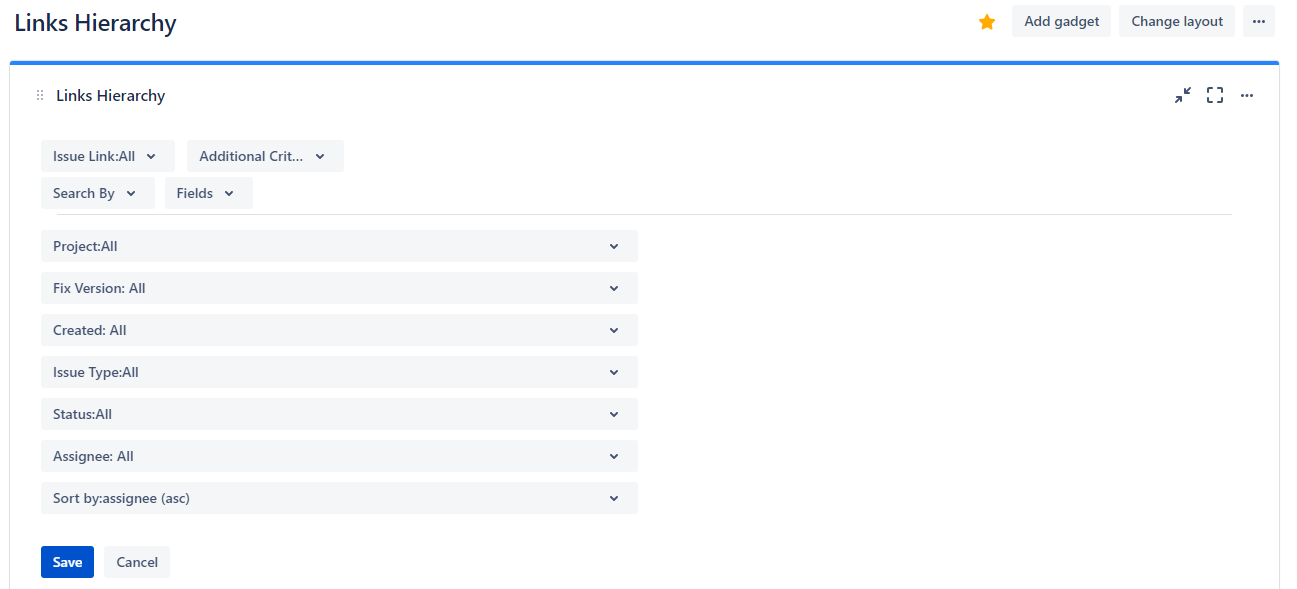
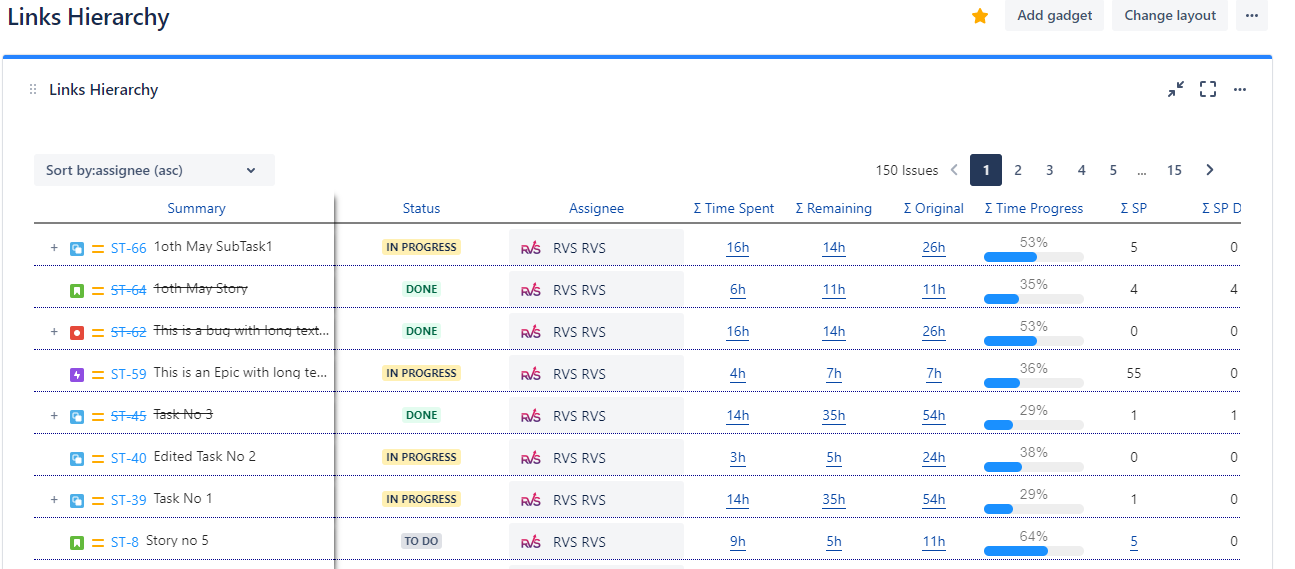
Links Hierarchy Gadget Configuration
Links Hierarchy Gadget
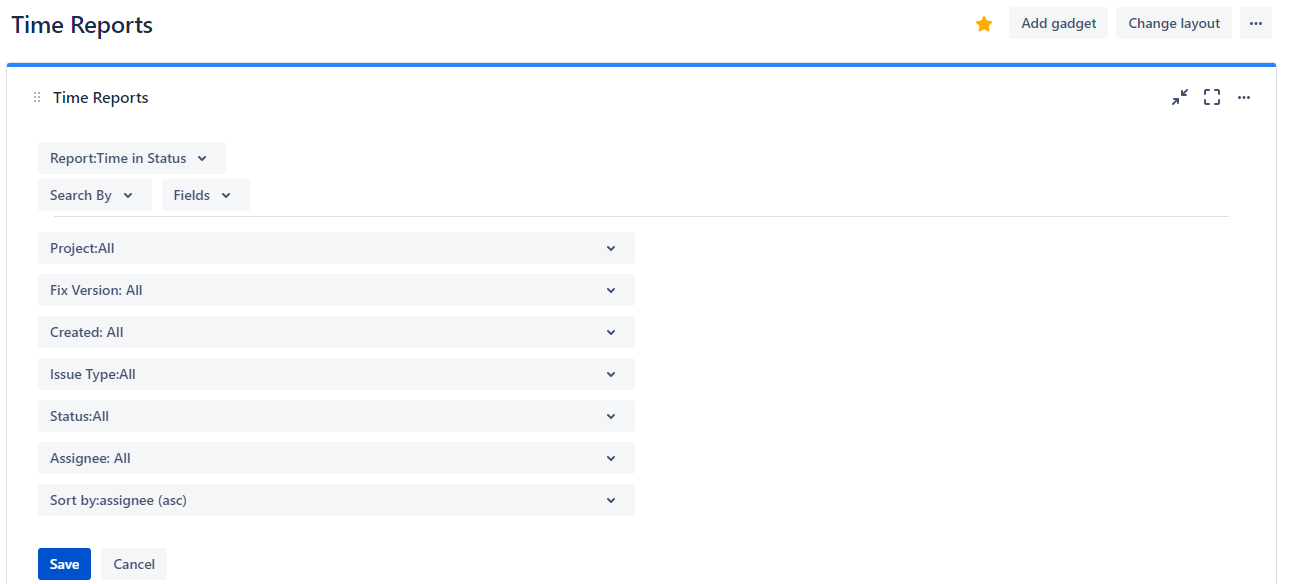
Time Reports Gadget Configuration
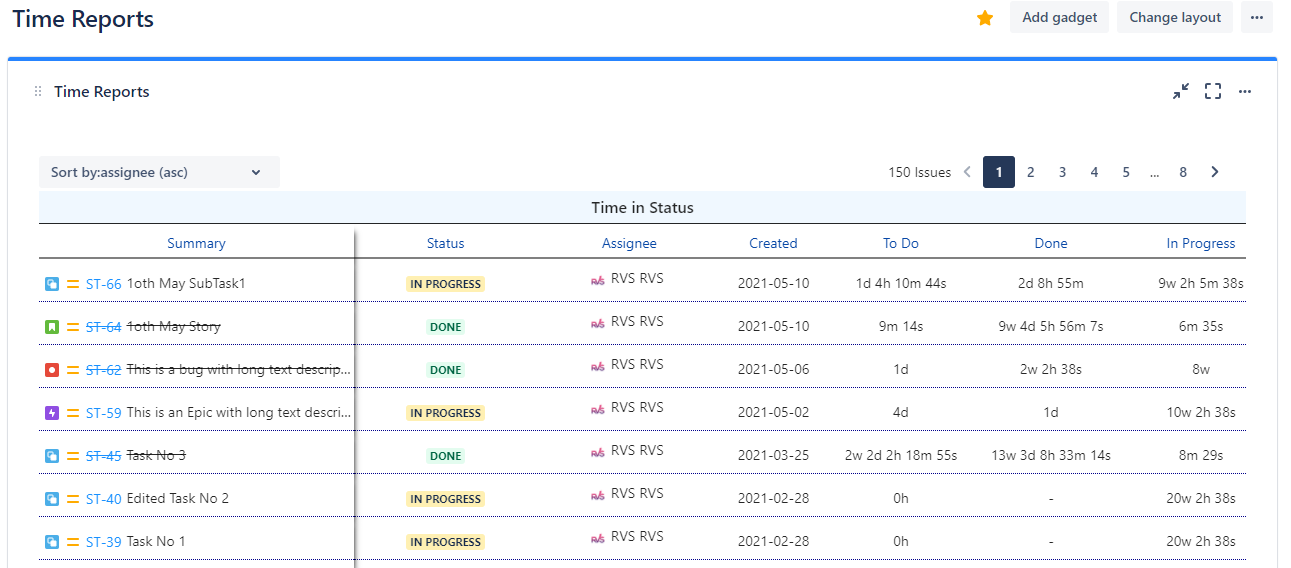
Time Reports Gadget
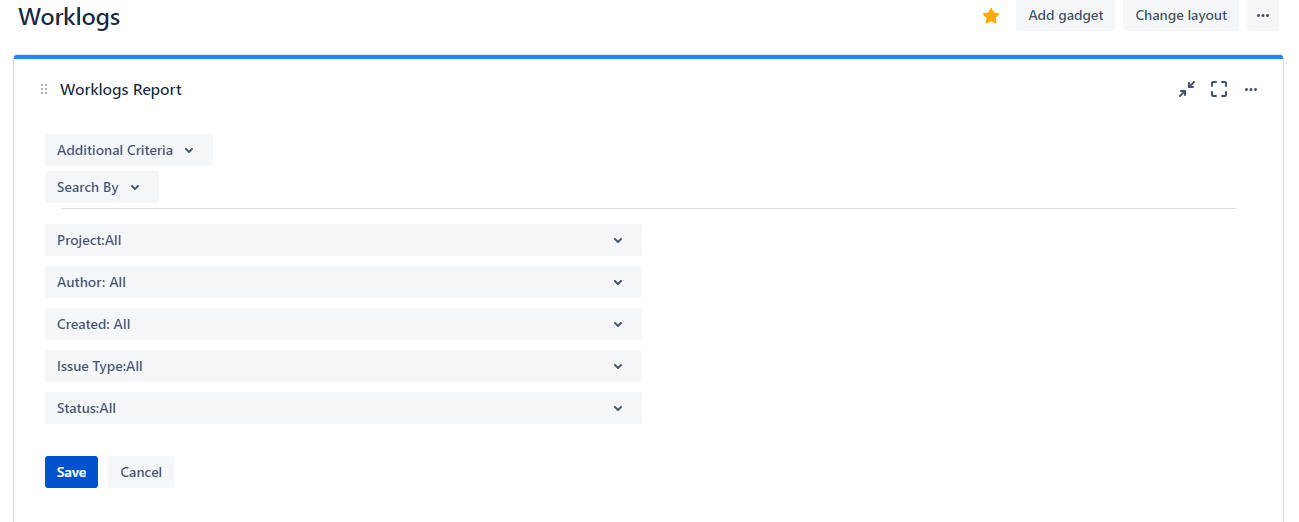
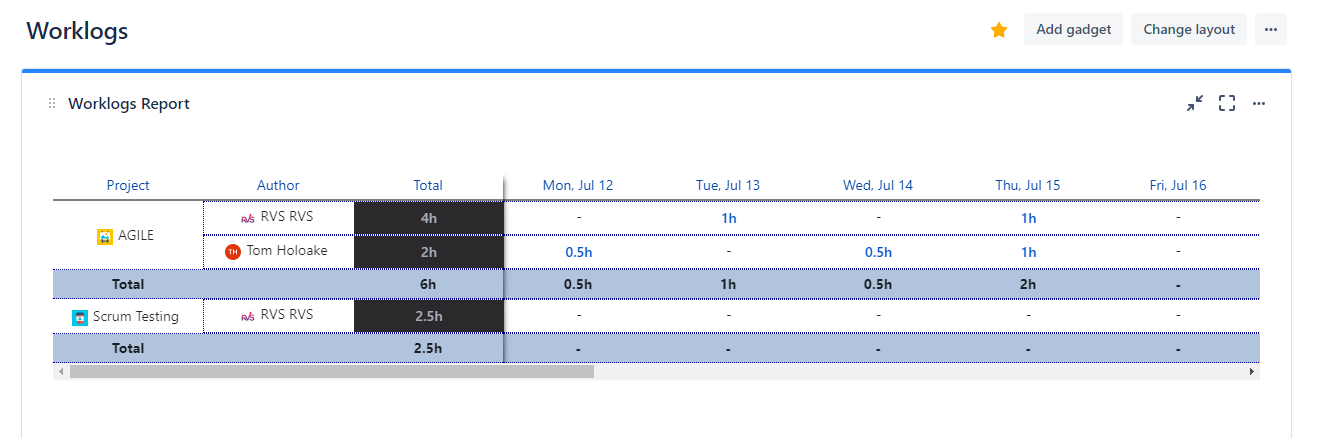
Worklogs Report Gadget Configuration
WorkLogs Report Gadget
Agile Tools settings
Settings for Agile Tools can be configured at two places:
1. Global Settings : Requires Jira admin privileges.
a. Jira Server / Data Center: Navigate to Settings → System page. You will find Agile Tools → Hierarchy Settings link on the left navigation bar, as per screen shot below.
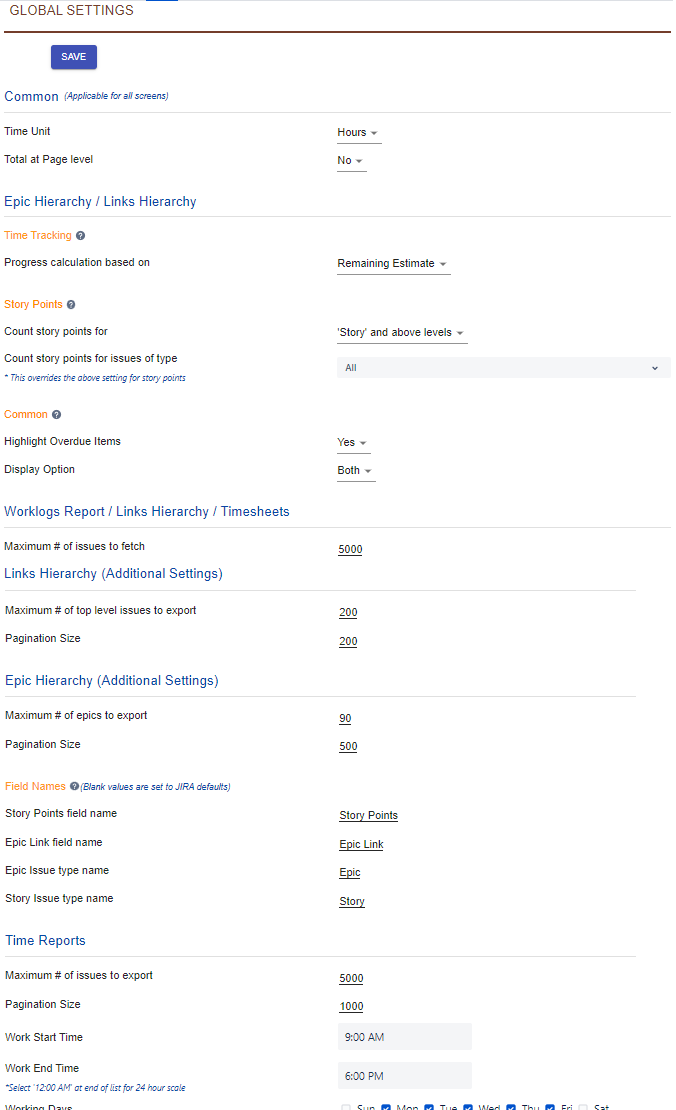
b. Jira Cloud : Navigate to Settings → Apps page. You will find Agile Tools → Hierarchy Settings link on the left navigation bar, as per screen shot below.
2. User Level Settings : User can override Global Settings, by changing the settings from any of the Agile Tools pages by clicking on the gear icon as below. The settings are per user and are cached locally on each user’s machine.
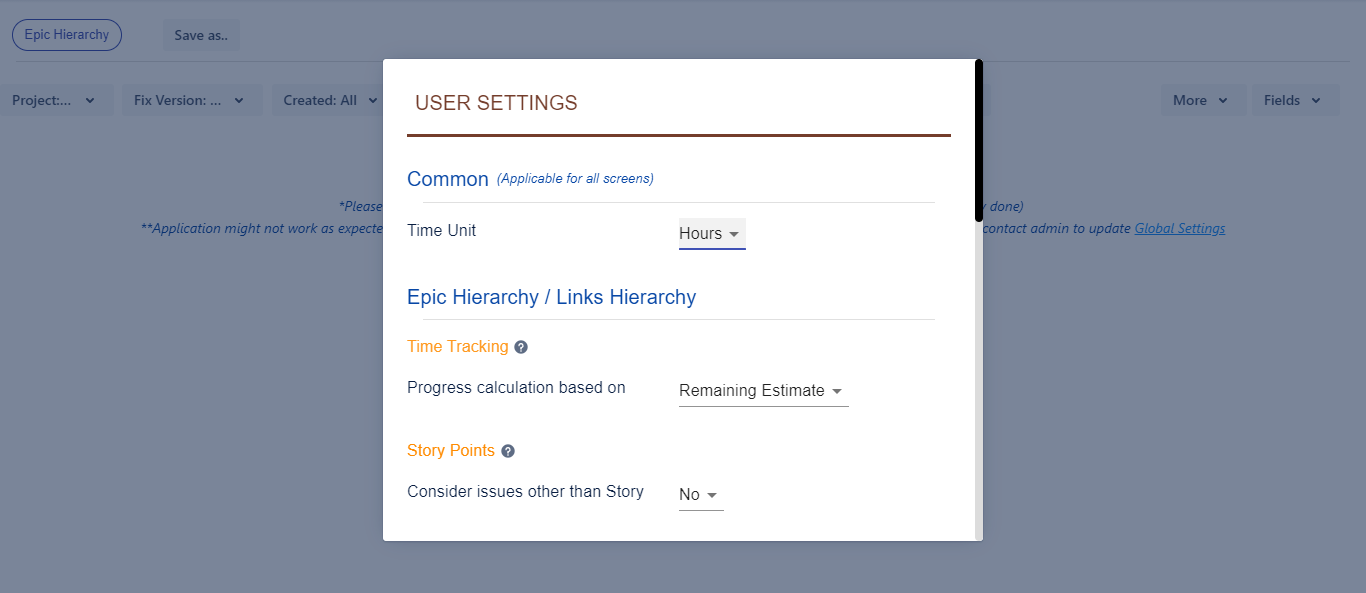
Clicking on Settings will open the following pop up screen.
The below settings can be changed :
Common : The time unit display on all the reports can be changed from here to either hours/days/default. More details explained here.
Epic Hierarchy / Links Hierarchy:
Time Tracking progress : The time progress % of all the issues of your project can be based on either remaining estimate or original estimate calculation. The formulae to calculate the same is described in detail here.
Story Points: If you wish to include story points for issue types other than Story, select the option “Consider Issues other than Story” to “Yes”. More details explained here.
Common : You can hide/show the columns on Epic Hierarchy or change the time Unit Display on Epic Hierarchy and TIS/TWA reports through this setting. More details explained here.
Field Names: If the Issue type names have been changed in your Jira instance you need to specify them in the global settings. More details explained here.
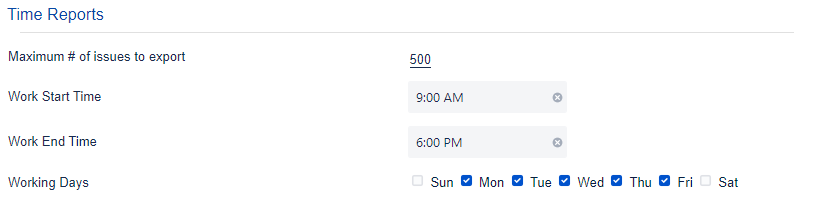
3. Time Reports : This setting is applicable to TIS and TWA report You can configure the working days
in a week and your working hours from this setting. Also the number of issues which can be exported to
Excel can be set from here. The max number allowed is 5000. More details explained here.
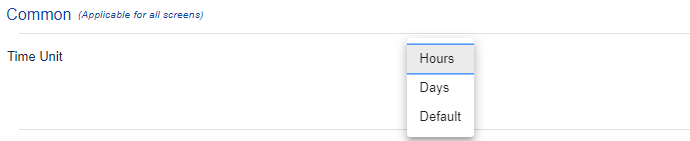
Common
This setting is applicable to all the screens on Agile Tools.
Time Unit : The time unit display on all the reports can be changed from here to either hours/days/default.
Epic Hierarchy / Links Hierarchy Settings
The Settings on this section are applicable to Epic Hierarchy and Links Hierarchy screens.
How Track Progress % is calculated
Progress Calculation based on Remaining Estimate :
Progress percentage is percentage of ‘Time Spent' (Time Tracking) out of the total 'Time Spent’ + 'Remaining Estimate'. For example, if
Time Spent = 3h
Remaining Estimate = 12h
Progress = (3 / (3+12) )*100 = 20%
Progress Calculation based on Original Estimate :
Progress percentage is percentage of 'Time Spent' (Time Tracking) out of the total 'Original Estimate'. For example, if
Time Spent = 4h
Original Estimate = 8h
Progress = (4 / 8)*100 = 50%
Progress Calculation based on Remaining vs Original Estimate :
Progress percentage is percentage of 'Original Estimate - Time Remaining' (Time Tracking) out of the total 'Original Estimate'. For example, if
Original Estimate = 4h
Remaining Estimate = 3h
Progress = (4 - 3)/4 = 25%
How are Time tracking fields calculated?
In Jira by default, Users can enter any values in Time Spent, Remaining Estimate & Original Estimate. And there is no interdependency between these fields. Except for one place where if both 'Remaining' and 'Original' are set 0, any update to either column will have the same value updated in other column. This add-on maintains the same functionality.
Story Points
If you wish to include story points for issue types other than Story, select the option “Consider Issues other than Story” to “Yes”.

Common Settings
The common settings are set at Global level by the Jira admin and can be overridden by the user by changing it on Epic Hierarchy or TIS/TWA report pages. The following options are available in this section.
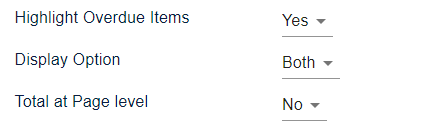
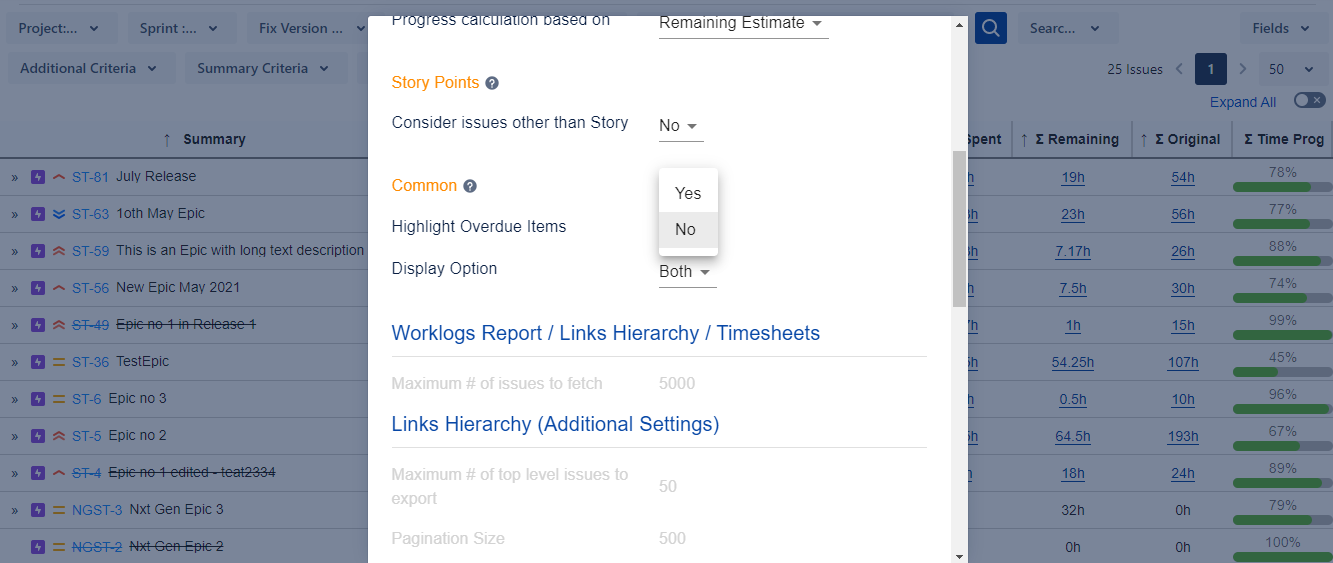
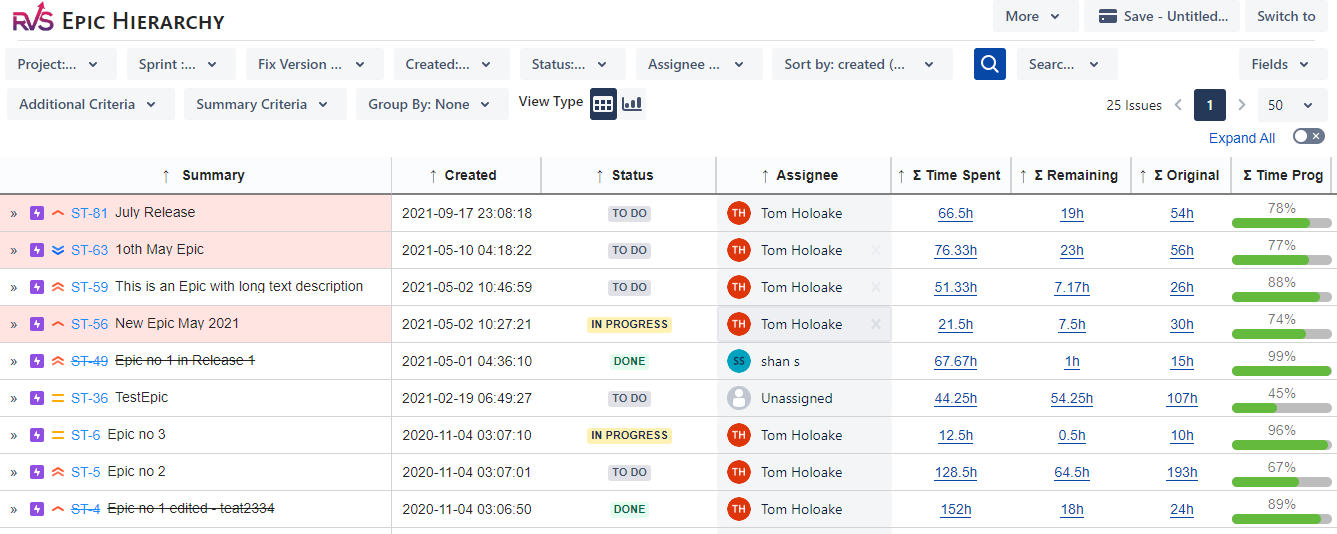
Highlight Overdue Items : Overdue items can be highlighted with this setting. If the issue is past due, it will show in red color. For items nearing due date, they will show in yellow color. Example below
Display Option : You can hide the worklog or story points columns on the screen by changing this setting. This setting will be overridden if you have changed the displayed fields on any of the Agile Tools screens.
Total at Page level : If you want to view the total of all Epic Hierarchy columns at each page level, you can change the value of this drop down to “Yes”.
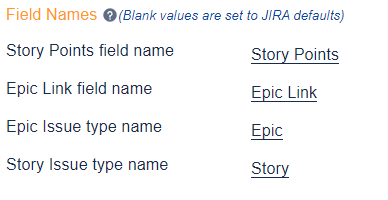
Field Names: Agile Tools looks for Epic & Story field names. If these Issue type names have been changed in your Jira instance you need to specify them in the Agile Tool Global settings.
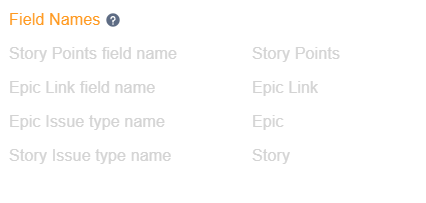
These field names are non editable on User settings page. They can only be set by the Jira admin on Global settings page.
Epic Hierarchy Additional Settings
Maximum no of Epics to Export: You can set how many issues can be exported to Excel from Epic Hierarchy screen. Max number allowed is 100.

Time Reports
The settings on this section are applicable to all Time in Status reports.
Maximum no of issues to Export: You can set how many issues can be exported to Excel from time in status and time with assignee screens. Max number allowed is 5000.
Working Hours: Configure the working hours for your firm. The timings set here will be used to calculate the time in status.
Working Days: The working days of your firm can be set from here. The days which are not selected will not be used to calculate the time in status.
Grouped Statuses Settings
You can group your Statuses to define your own Cycle time, Lead time or any other grouping.
The app will sum up the time in each of the statuses which are grouped together.
Jira Server / Data Center: Navigate to Settings → System page. You will find Time in Status Reports → Grouped Statuses link on the left navigation bar, as per screen shot below.
Cloud: Navigate to Settings → Apps page. You will find Agile Tools → Grouped Statuses link on the left navigation bar, as per screen shot below.
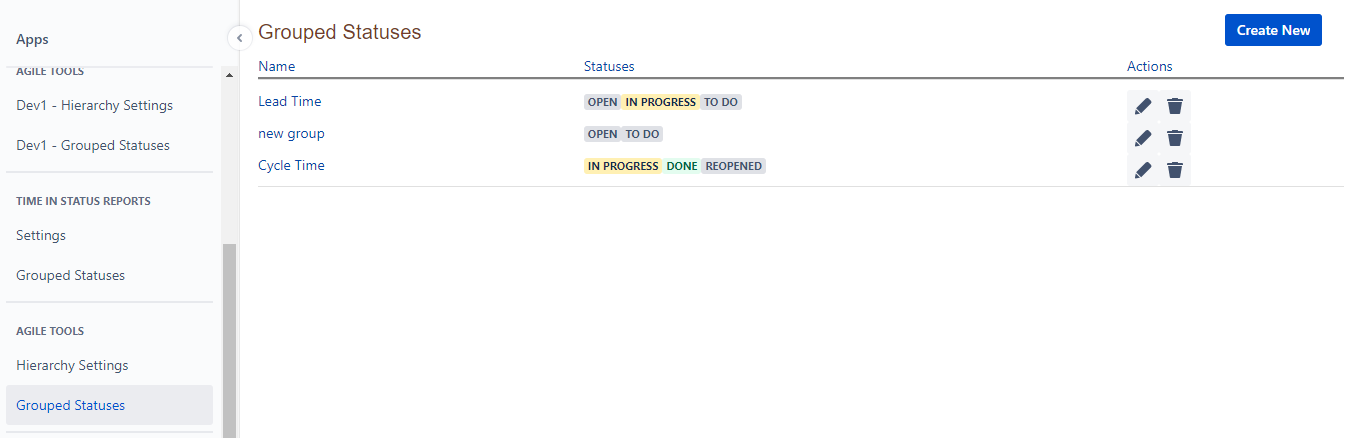
Click on “+” sign on top right to add a Status group. Click on “Save” icon after you are done.
Display Fields/Columns on All the Reports
Agile Tools provides the option to add/remove columns on all the screens. There can be different columns shown on each of the reports as each screen details are saved separately.
Click on “Fields” Button on top right of the report. It will open the pop-up as shown below and you can add/ remove them as per your needs. You can also change the ordering of the displayed columns.
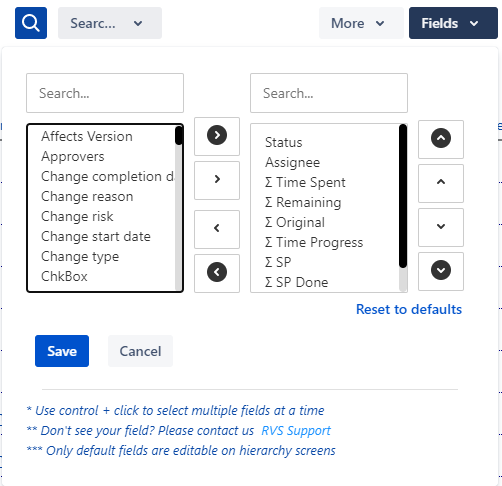
Reset to Defaults option :- The Reset to default option on the Fields pop-up is linked to the “Display Option” on the Settings screen.
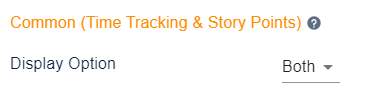
If you have selected “Both” in this setting then clicking on “Reset to default” will select all the time tracking and story points fields.
If you have selected “Worklogs” in this setting then clicking on “Reset to default” will select only the time tracking fields.
If you have selected “Story Points” in this setting then clicking on “Reset to default” will select only the story points fields.
Prerequisites
Agile Tools add-on looks for the “Story Points” and “Time Tracking” fields in Projects. Ensure you’re using these fields to estimate issues.
Please follow the below steps to enable the same
Navigate to Administration -> Issues -> Screens
a. Select your project’s “<Project Name>: Scrum Default Issue Screen”. Click on Configure
b. Add the following fields to this screen
i. Time Tracking
ii. Story Points
FAQs
How to Highlight Overdue Issues
Overdue items can be highlighted on the Hierarchy Report by updating the settings as shown in the screen below.
Setting it to “Yes” will highlight overdue items in light red based on “Due Date” as below.
How to view quick project summary
You can view a quick summary of your projects using Summary Reports option on the Hierarchy Screens and Time in Status screen as well. This feature also allows to slice and dice your data using JQL and get a bird’s eye view of the progress.
The details are available on this page.
How to view Links & standard Jira Hierarchy together
The Links hierarchy module allows you to visualize the hierarchy based on your issue links and your standard Jira hierarchy (Epic → Story/Task → Subtask) as well.
These two hierarchies can also be combined for a common view.
The details of the same are available on this page.
How to create cycle/resolution/lead time reports
The app allows you to create your own cycle time, lead time etc.
You can achieve this by grouping your statuses as explained on this page.
My Reports are taking longer than expected time to load
Our plugin uses Jira issue search API and the page load time are directly impacted by the response time from these API’s. In large dataset environments it might take few seconds to load.
How to create child issues and create hierarchy
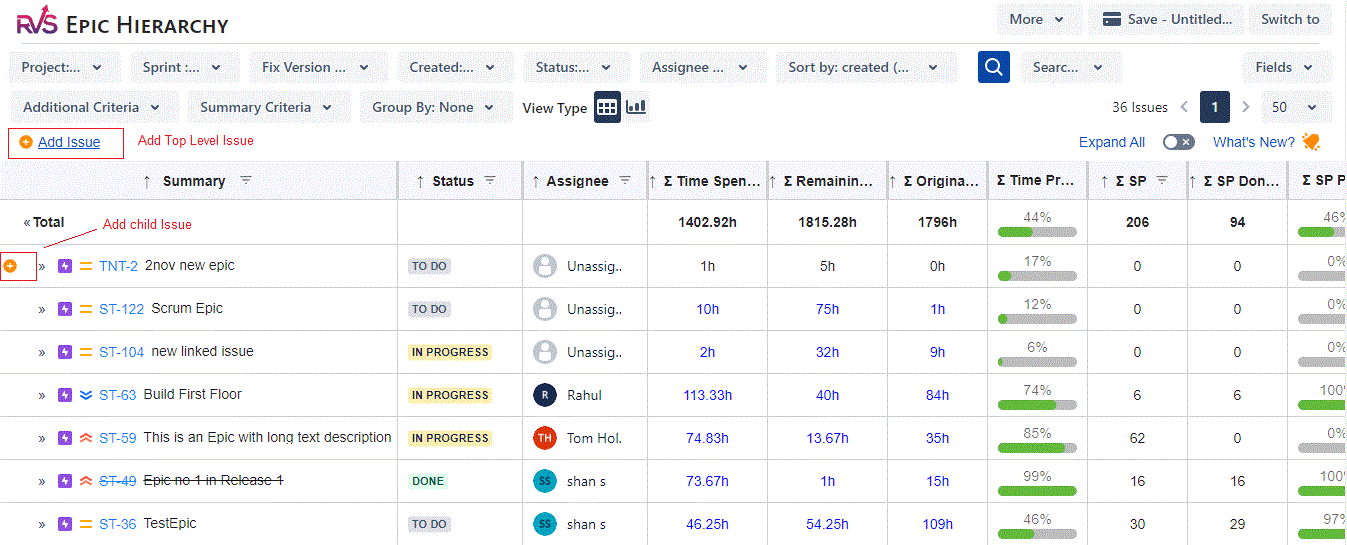
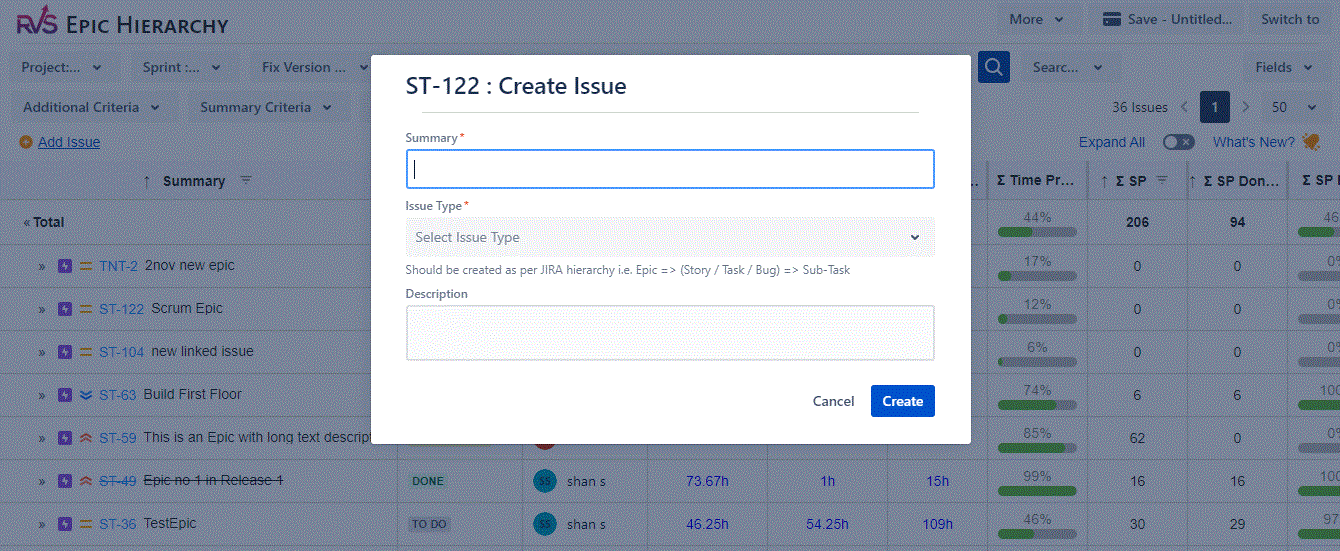
The app allows to create your issues and add them to your hierarchy from the app screen itself. You do not need to navigate to the issue screen to create your issues.
Issues can be added at top level and child level as shown in the screen below
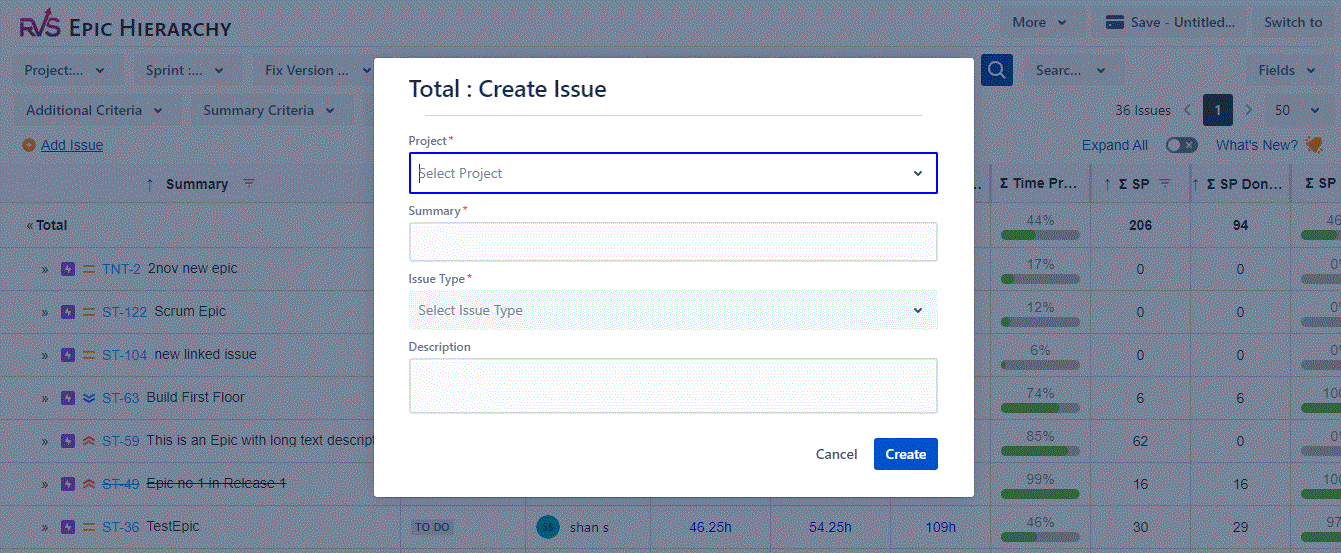
Adding a top level issue will open the below pop up
Add a child issue will open the pop up which reflects the parent issue ID
How to create a linked issue
The app allows to create your issues and link them to your hierarchy from the app screen itself. You do not need to navigate to the issue screen to create your issues.
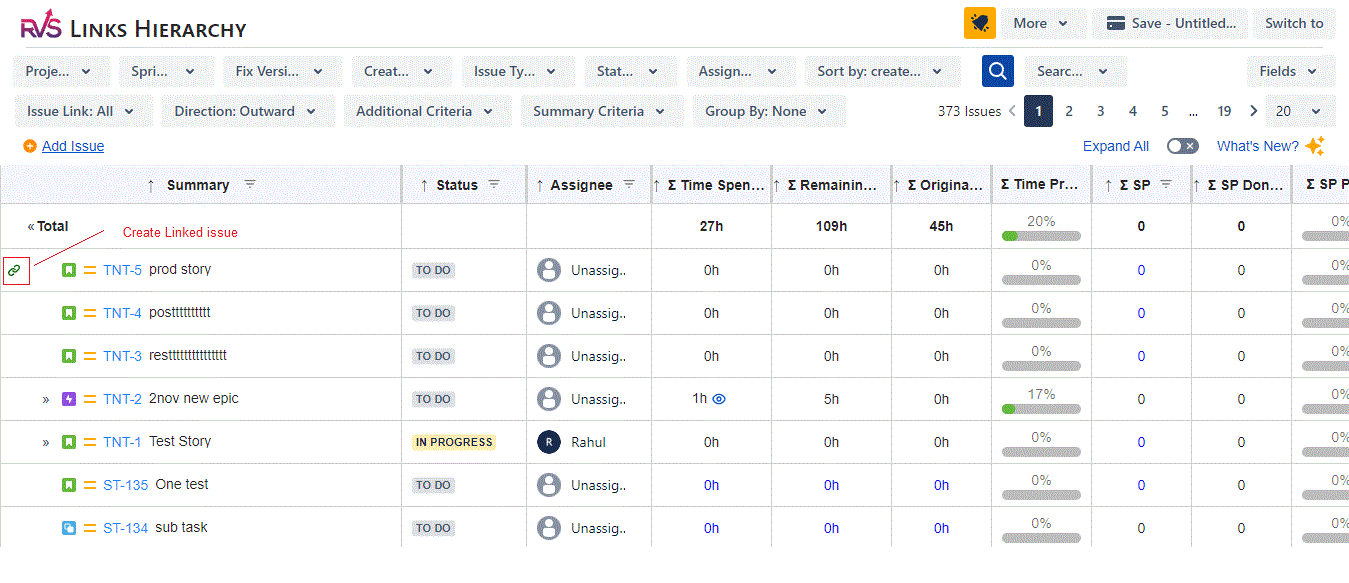
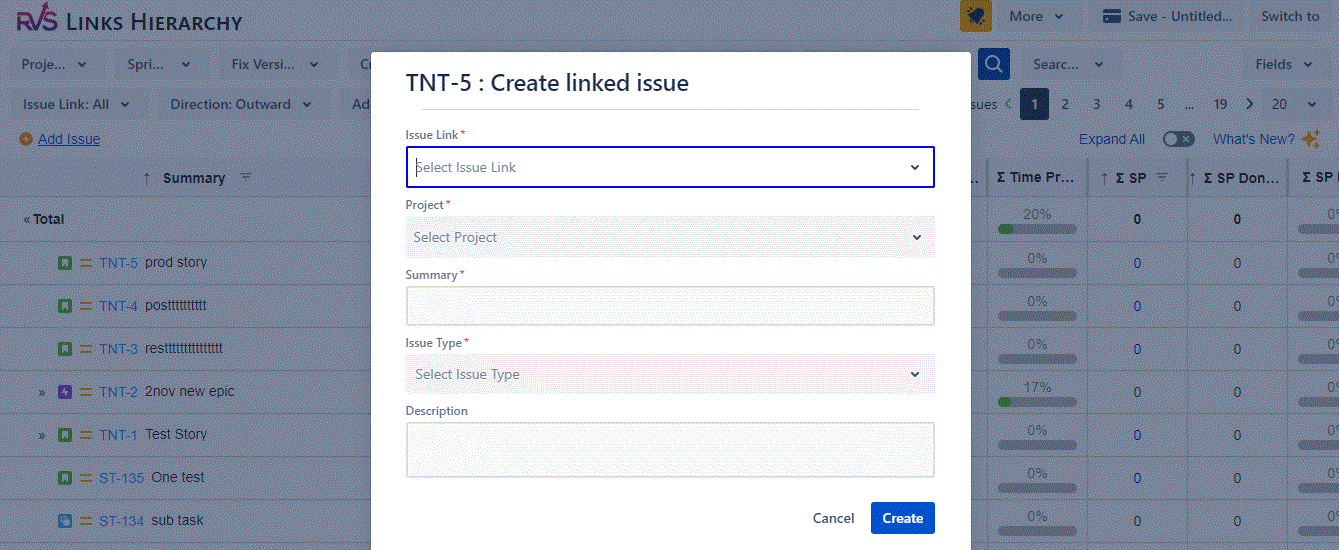
Clicking on the link will open a pop up as shown. You need to select the issue link in the pop to link your issue to the parent.
How to apply local table level filters
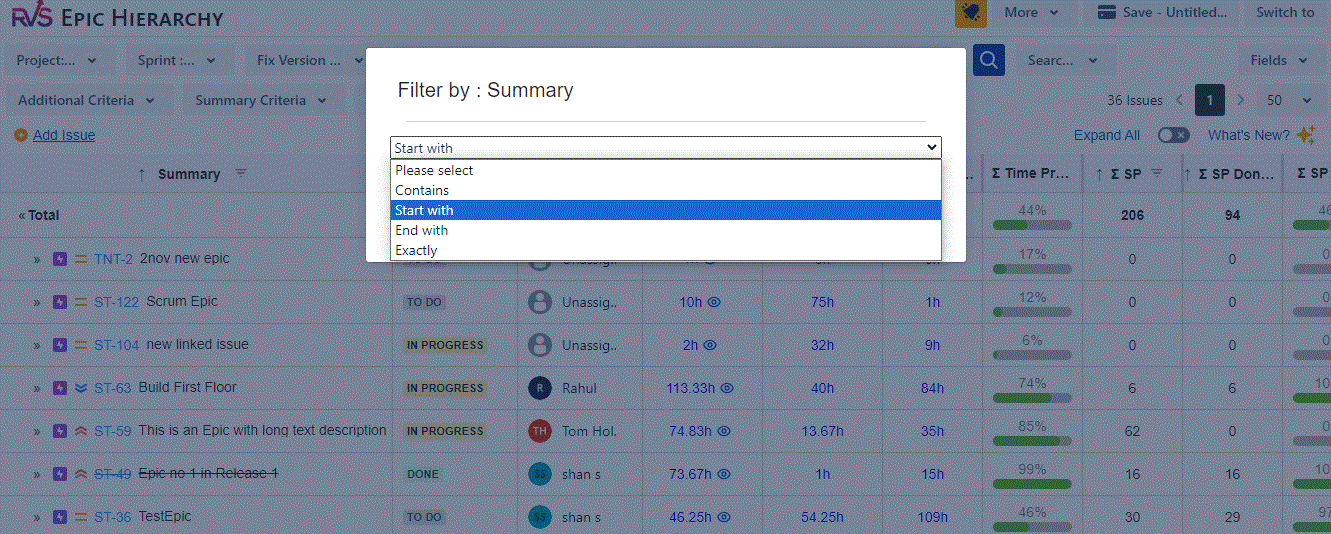
Applying local table-level filters is a powerful way to slice and dice your data within a specific dataset. These filters allow you to focus on a subset of data that meets specific criteria, providing a more detailed and tailored view.
Applying Local Table-Level Filters:
Open the Data Table:
Navigate to the data table within your application or analytics platform where you want to apply filters.
Identify Columns for Filtering:
Determine the columns (attributes or dimensions) in your dataset that you want to use for filtering. These could be categorical or numerical variables.
Select Columns to Filter:
Choose the columns you want to filter by. For example, if you have a "Date" column, you might want to filter data for a specific time range.
Define Filter Criteria:
Specify the filter criteria based on your requirements. This could include selecting specific values, setting a date range, or defining a numerical range.
Apply Filters:
Once you've set the filter criteria, apply the filters to the dataset. The table will update to display only the rows that meet the specified conditions.
Review Filtered Data:
Take a moment to review the filtered data. You should now see a subset of information that aligns with the criteria you set.
Modify or Remove Filters:
If needed, you can modify or remove filters to adjust your view of the data. This flexibility allows you to interactively explore different aspects of your dataset.
Example Use Cases:
Time-Based Filtering:
Filter data to show only records within a specific date range.
Numeric Range Filtering:
Narrow down data based on numerical criteria, like sales values within a certain range.
Text-Based Filtering:
Filter data to include only rows that contain specific keywords or text.
Text Filter :
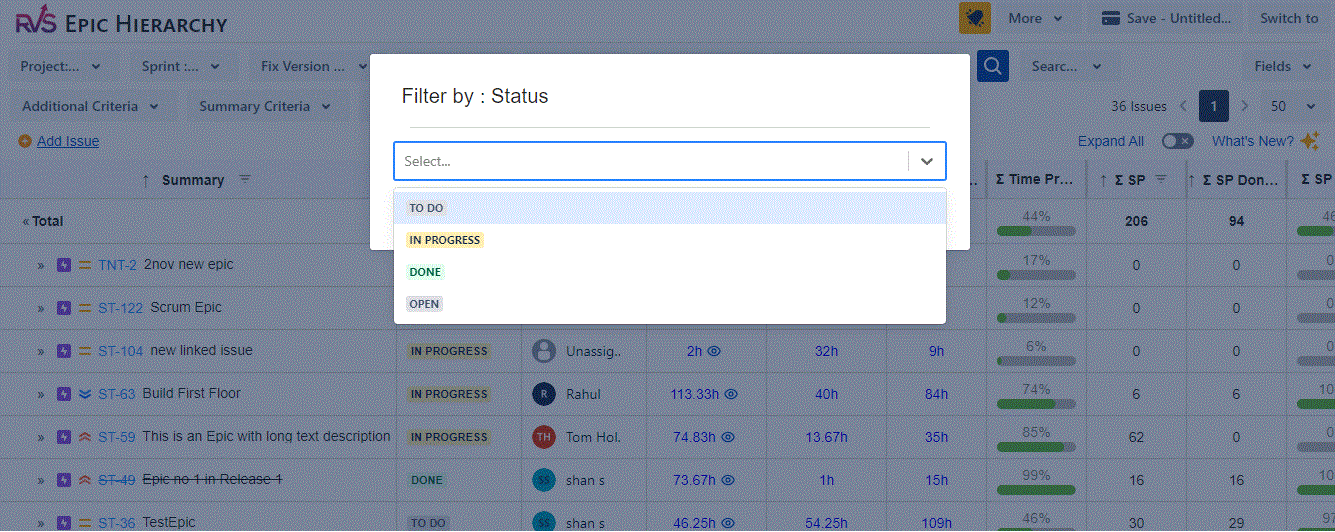
Status Filter :
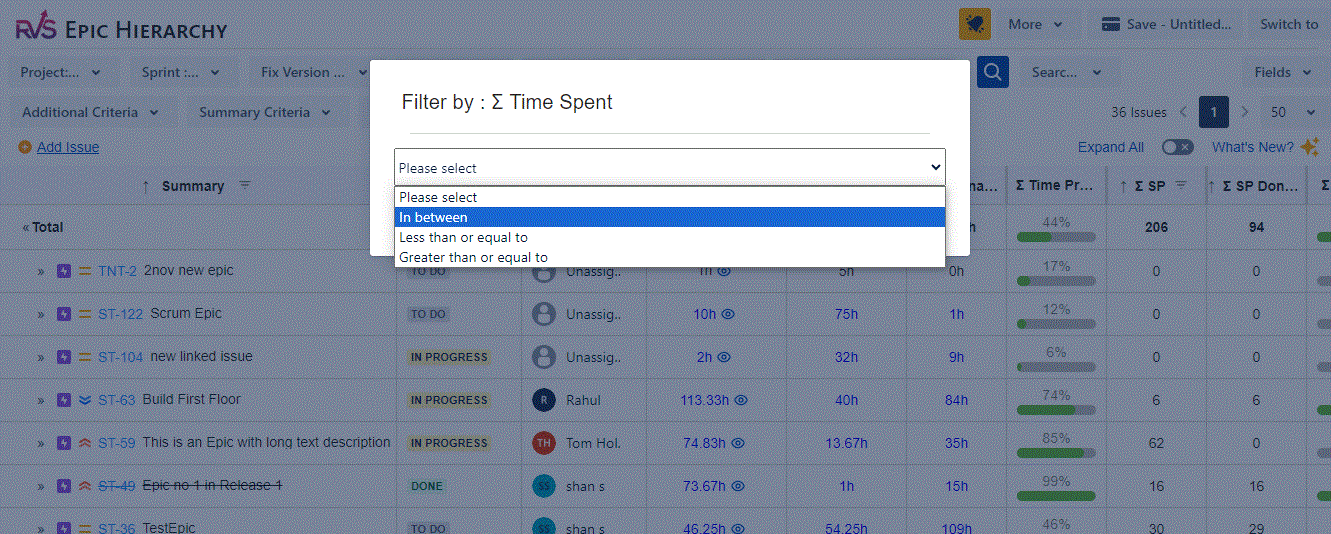
Numeric Filter :
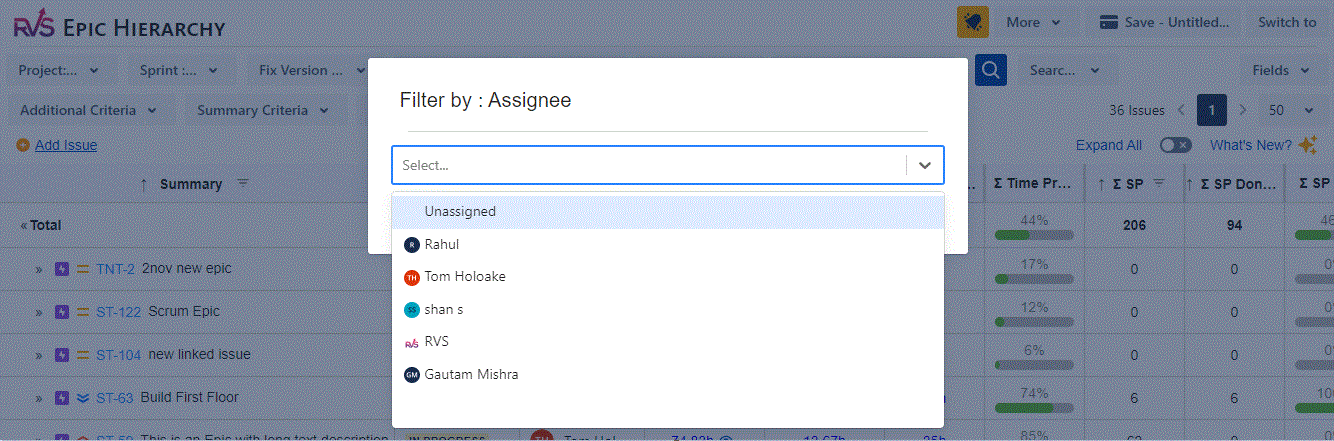
Assignee Filter :
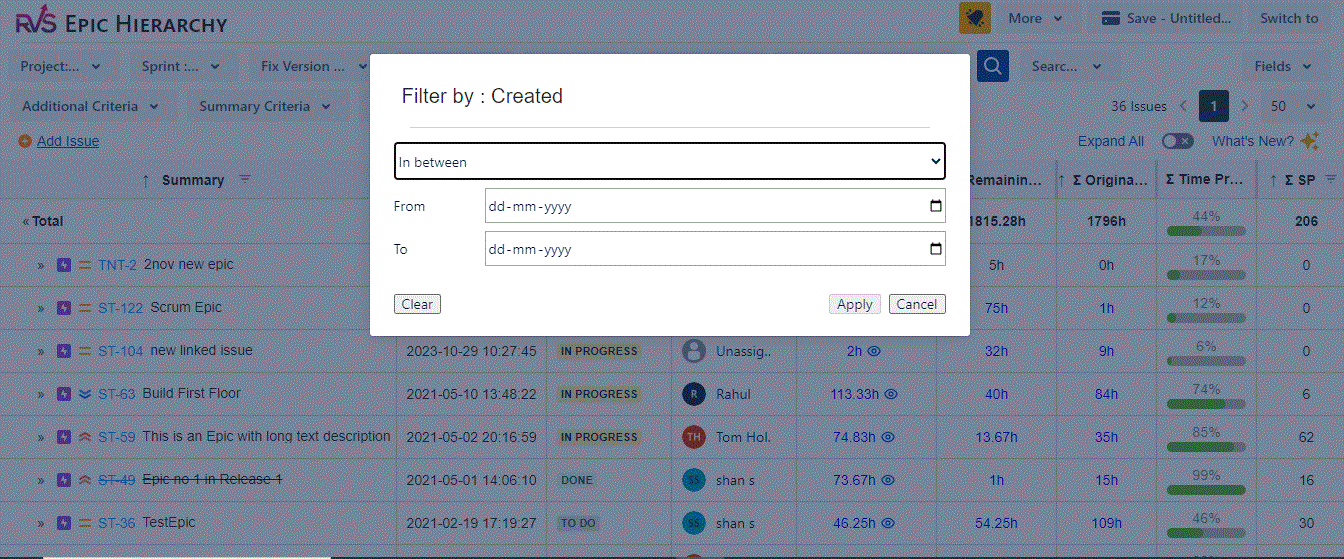
Date Filter :
How to export a flat hierarchy to csv
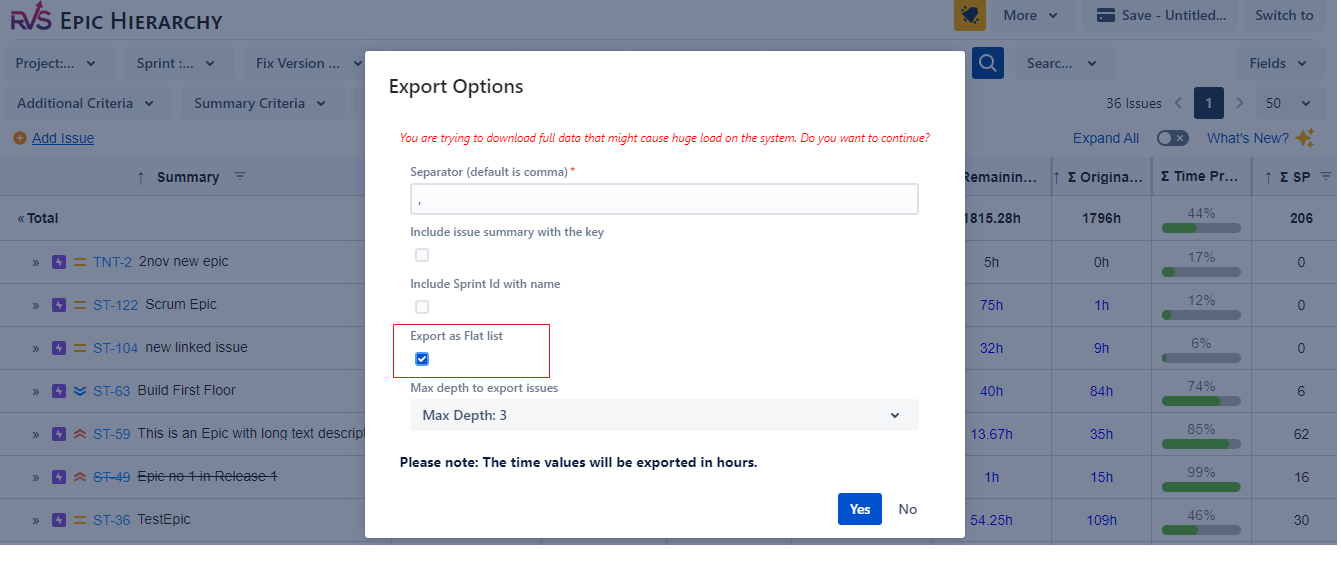
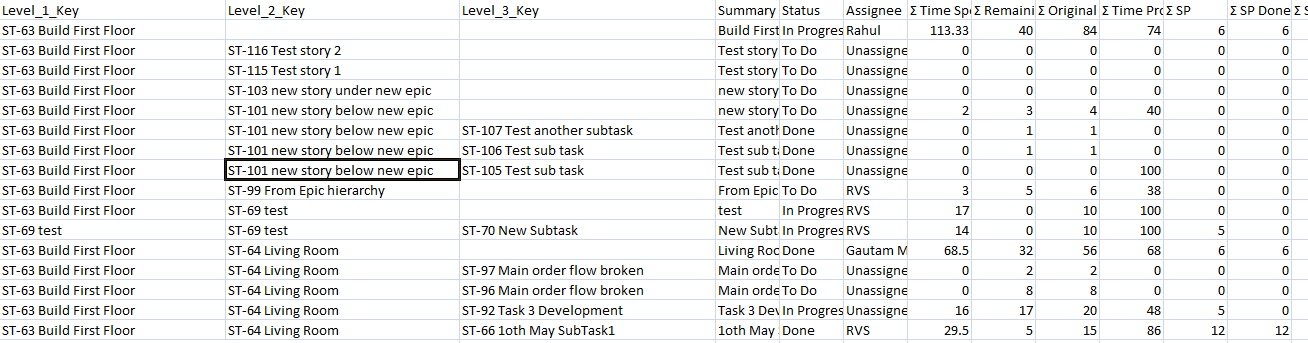
You can export your hierarchy data to a CSV file either in the regular hierarchy structure or a flat structure.
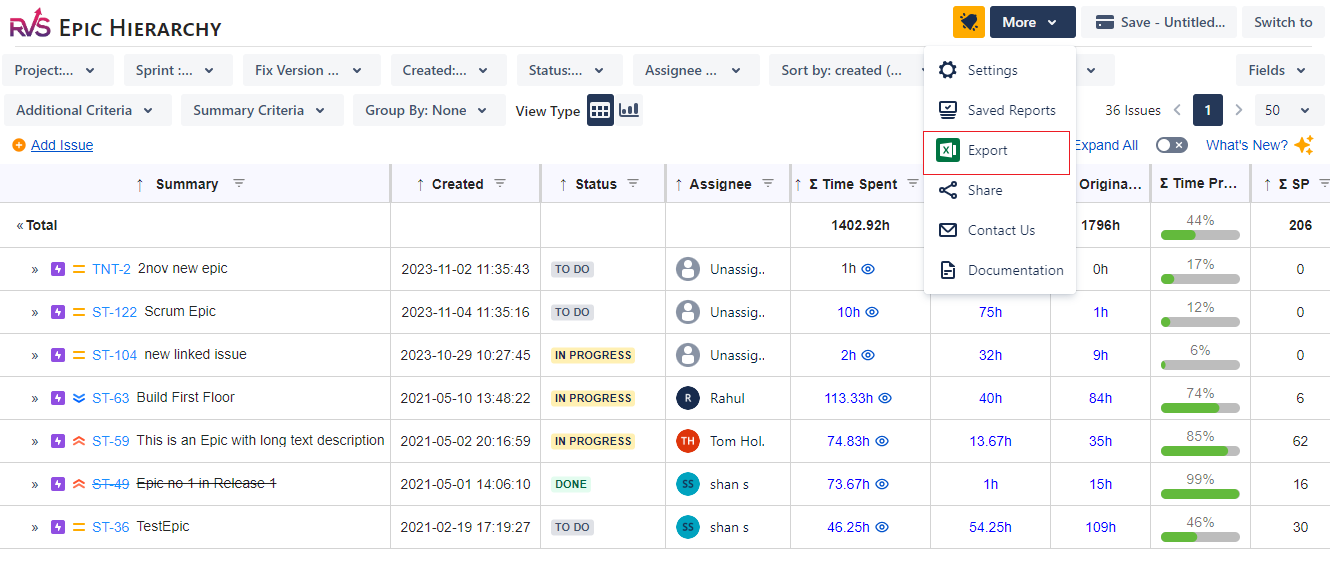
Regular Hierarchy Export :
Flat Structure Export : For a flat export, select the option as shown below in the export pop up
How to view worklogs on the hierarchy screen
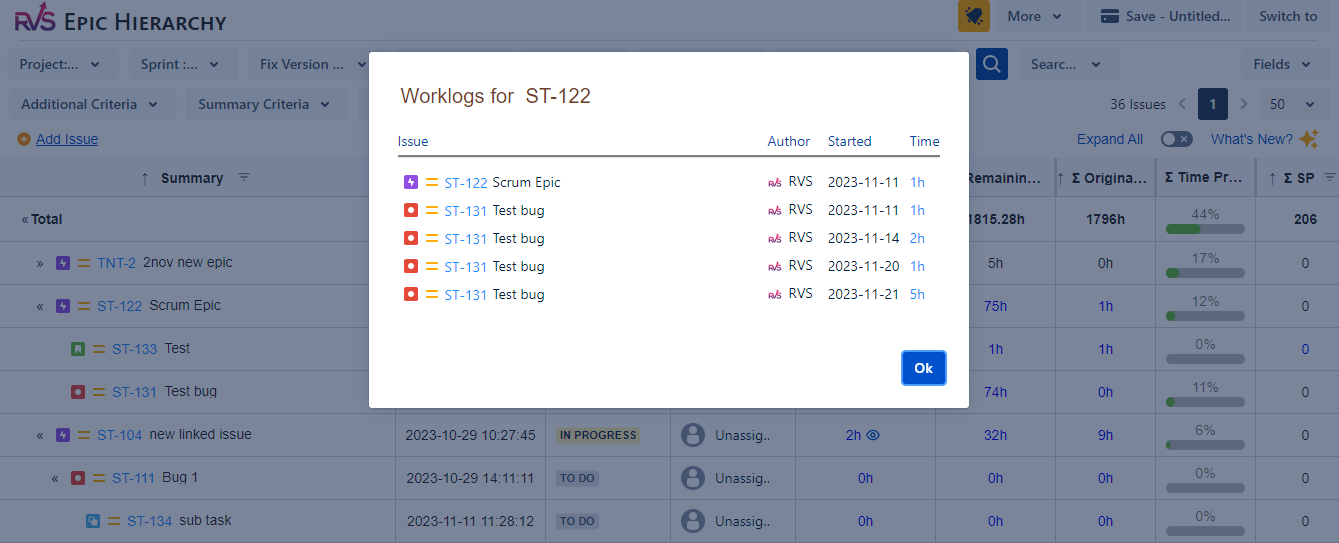
Now you can view the detailed time spent for each issue and also of the child issues on the hierarchy screens
Click on the “eye” icon on the time spent column at the issue row
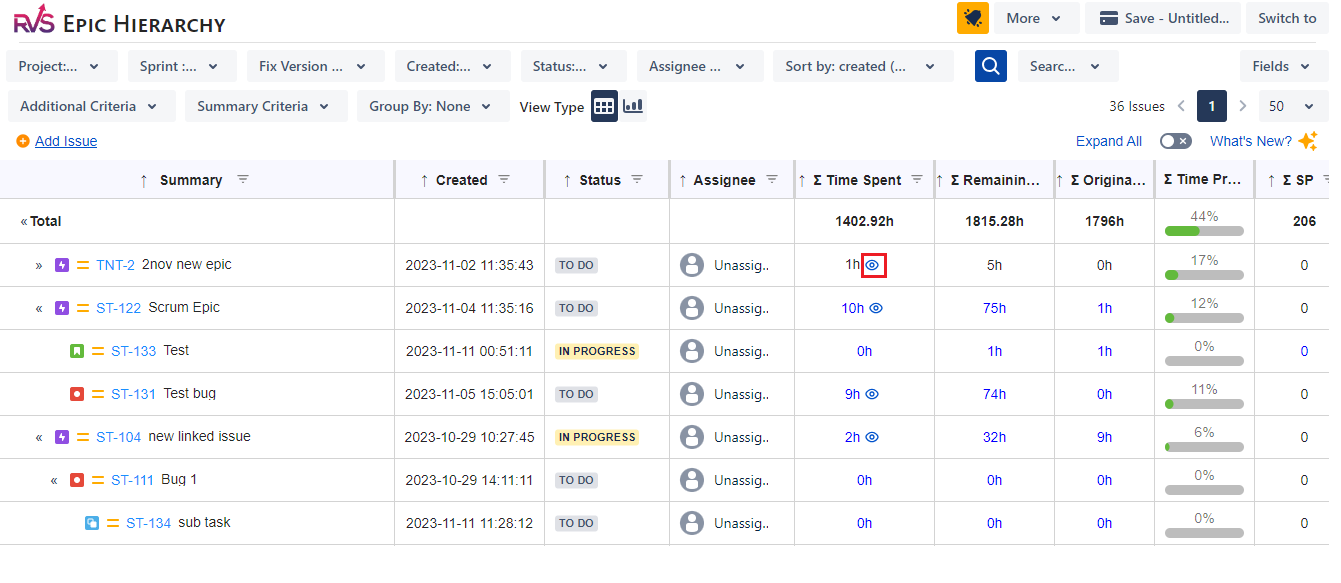
Clicking on it opens the pop up as shown. The pop up show the time spent at issue level in the hierarchy.
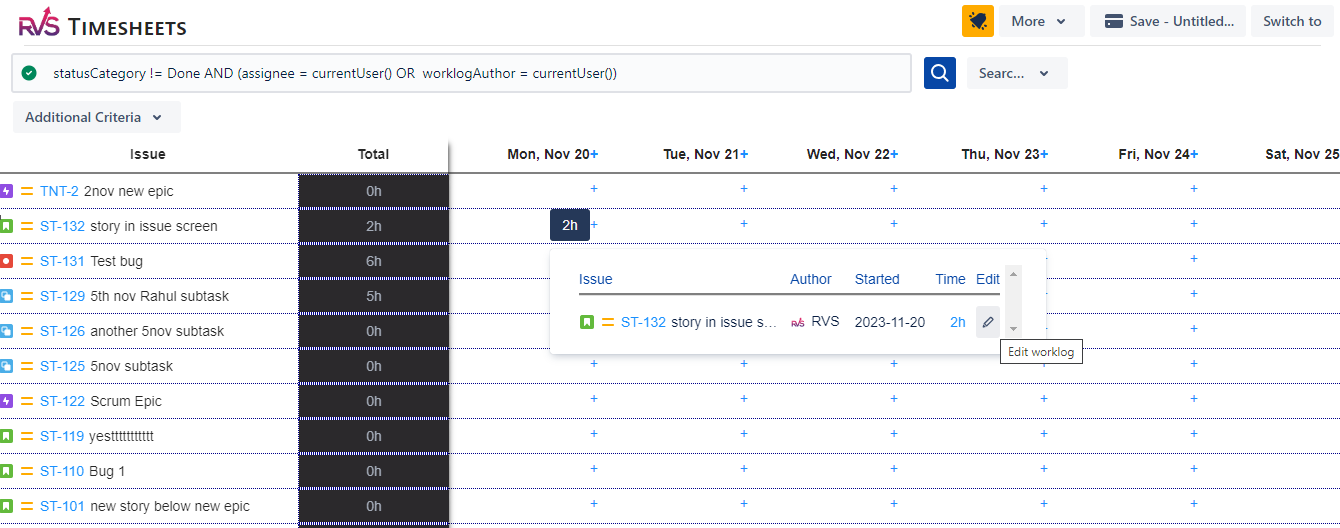
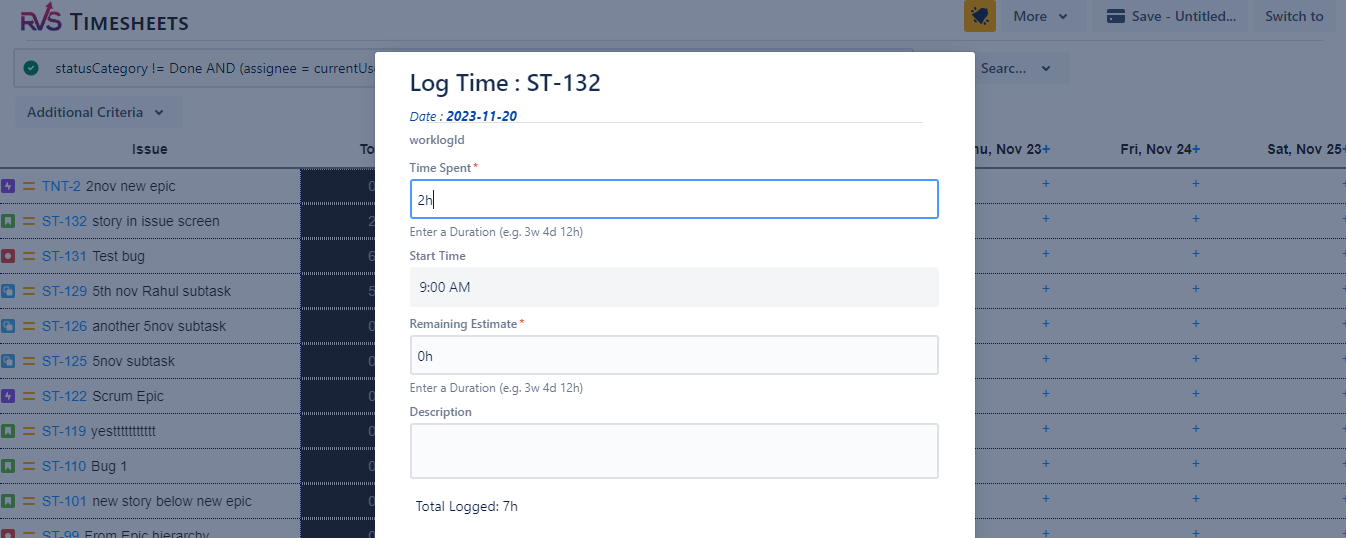
How to edit time spent (worklogs)
No need to worry if you have entered incorrect time for the issues you have worked on. Navigate to the Timesheet screen and click on the time entered on the particular issue. And then click on the edit icon as shown.
Help & Support
Please raise a support request here, or email us at support@votazz.co.
To help us respond quickly and accurately, include the app version, your Jira version, your browser, and the steps to reproduce the issue with examples or screenshots.