Time in Status Reports
"Time in Status in Jira" indicates how long a project task has been in a particular stage / status, such as "In Progress", "Pending" or "Completed". You will need this data to understand which issue has spent most time in which status or with which assignee, and take appropriate actions. To achieve all this, you will need comprehensive overview of the time spent in each project stage. Time in Status Reports by Votazz is one tool which can help you achieve this objective.
Installation
Here are the steps to install the Time in Status Reports app from the Atlassian Marketplace:
1. Access the Atlassian Marketplace
Open your browser and go to the Atlassian Marketplace.
2. Find the App
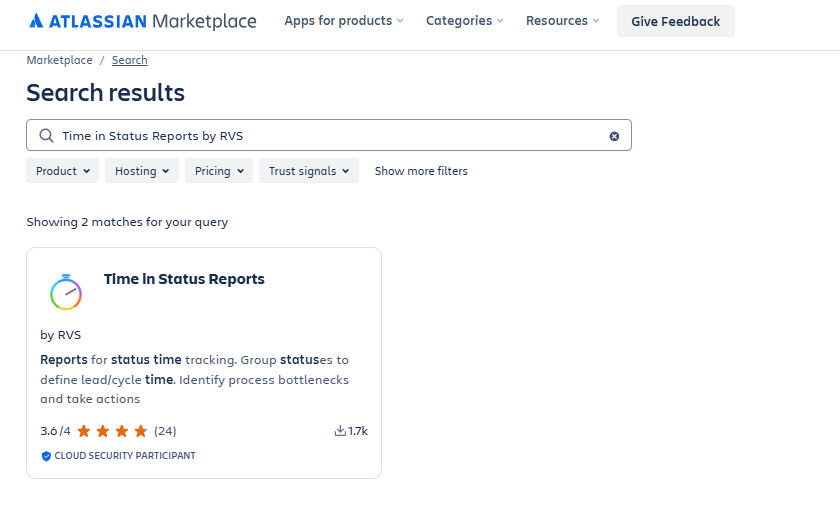
Use the search bar and type “Votazz or "Time in Status Reports by Votazz"
Select the app from the search results.
3. Choose Your Jira Instance
On the app's page, click Try it free or Get it now.
Select the Jira instance you want to install the app on and click Continue.
4. Log in to Your Jira Instance
Log in to your Jira Cloud instance if you're not already logged in.
5. Access the App
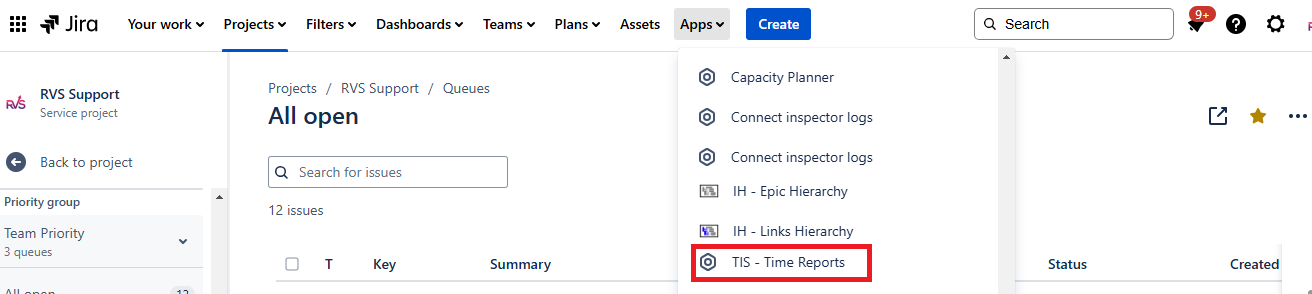
Once installed, you can find the “TIS - Time Reports” app under the Apps section in the Jira navigation bar.
Various Time in Status Reports
Clicking on “Apps → TIS - Time Reports” on Jira Cloud or “Top Nav Bar → Time in Status” on Jira DC, will navigate to the below screen. Select the Project, Fix Version and From/To Dates, along with the report type to view
App provides multiple Time in Status Reports to track your Issue as per below list. It also provides
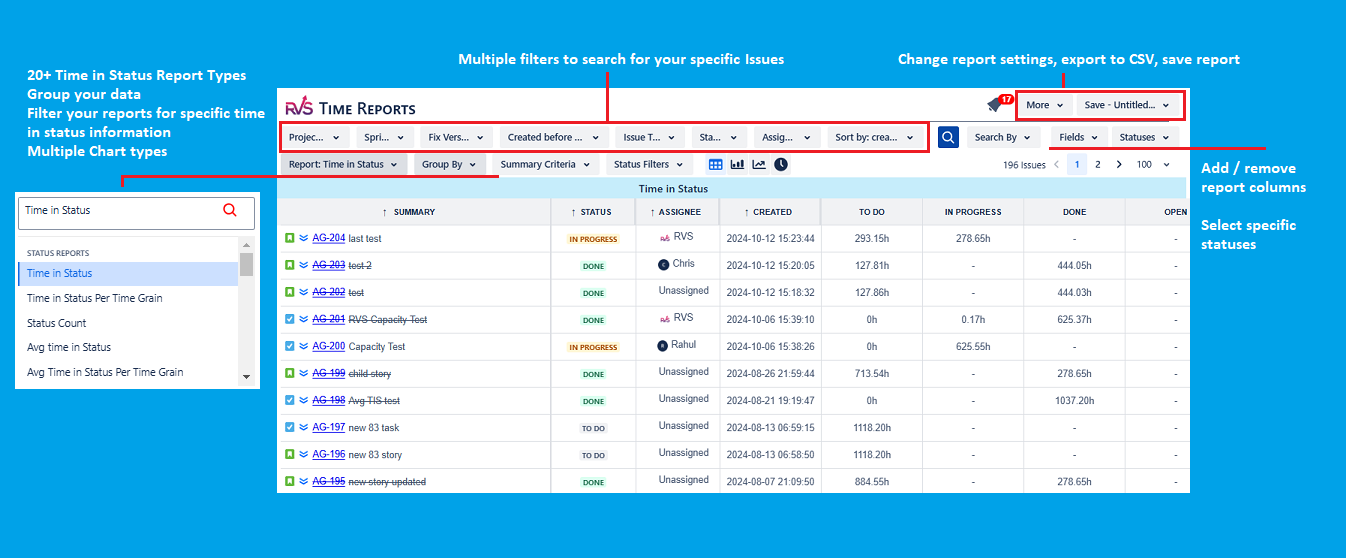
Export to Excel : All the reports provide the facility to Export to Excel. The Time values in reports are exported by default in Hours only to Excel
Settings : The time value in reports can be changed in Settings screen. They can be seen in Hours/Days & Jira default format
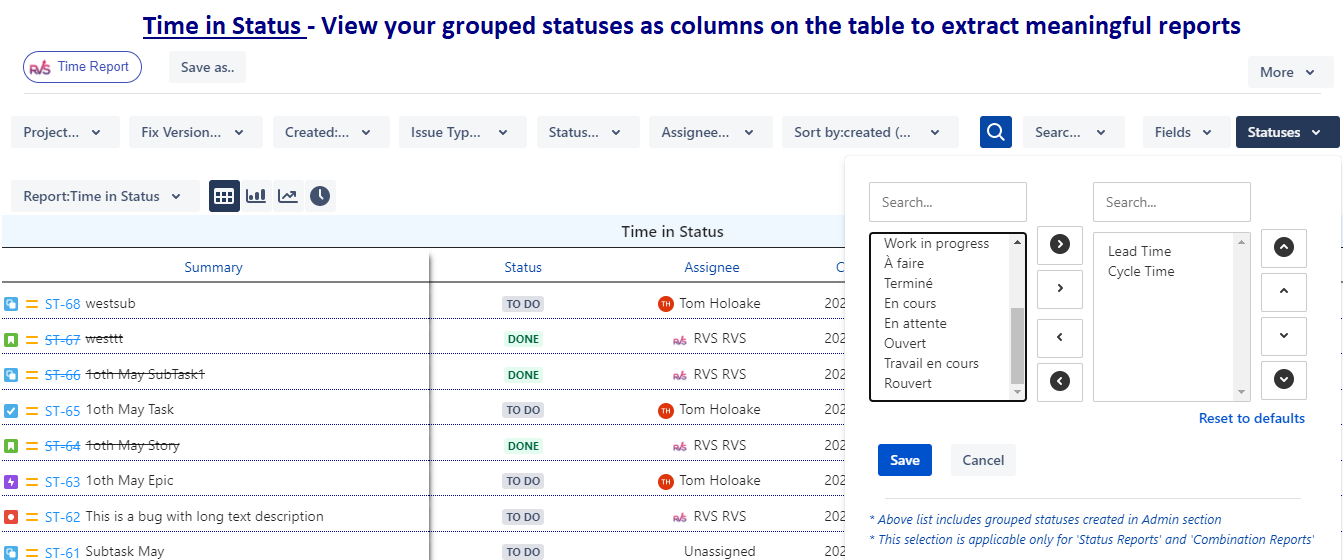
Statuses: You can define which statuses or grouped statuses you want to view on the report, by clicking on Statuses drop down on the right of the screen.
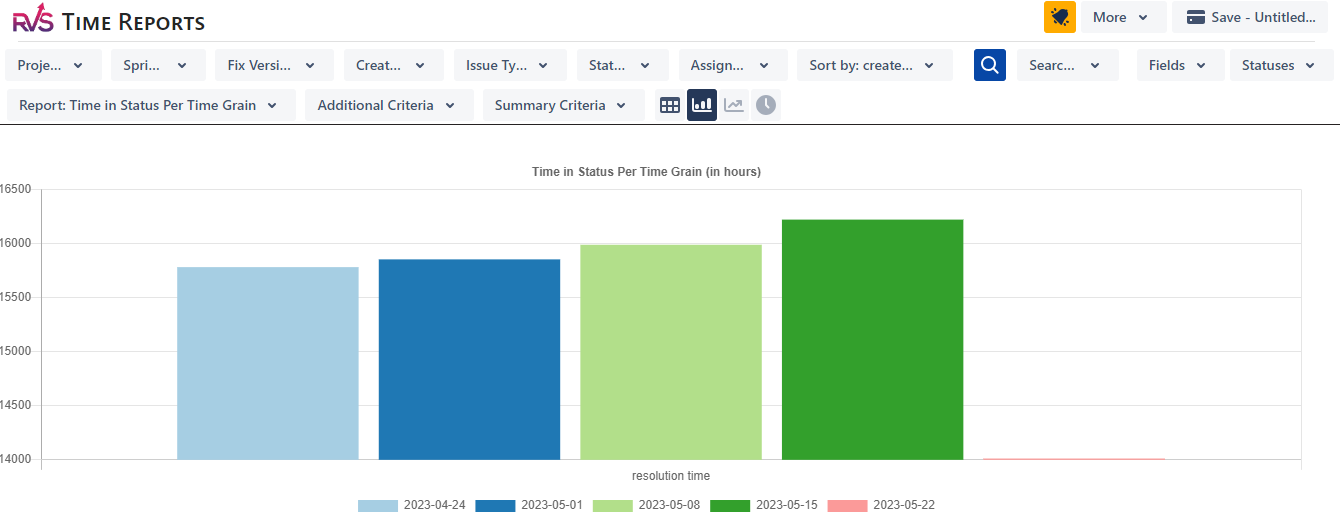
Additional Criteria : This option is enabled when you want to view “Time in Status Per Time Grain” or “Time with Assignee Per Time Grain” reports.
Reports:
Time in Status - Total time, the issue was in each of your Status
Time in Status Count - Number of times, the issue was in each Status
Time in Status Per Time Grain - You can compare status times over a historic duration and take actions if the time in status are not improving.
Time with Assignee - Total time, the issue was with each Assignee
Time with Assignee Count - Number of times, issue was with each Assignee
Time in Status per Assignee - Total time, the issue was in each Status with Assignee
Time with Assignee per Status - Total time, the issue was with Assignee per Status
Transition Reports : Multiple Transition Reports
Time in Status Report
Install Time in Status Reports app from the Atlassian Marketplace:
This report shows the total time taken by the issues in each status.
On the app screen
Search your issues with multiple filter options
Select the “Time in Status” report.
You can also add/remove fields from the report and also focus on time in specific statuses for your issues by selecting the desired ones from the Status dropdown.
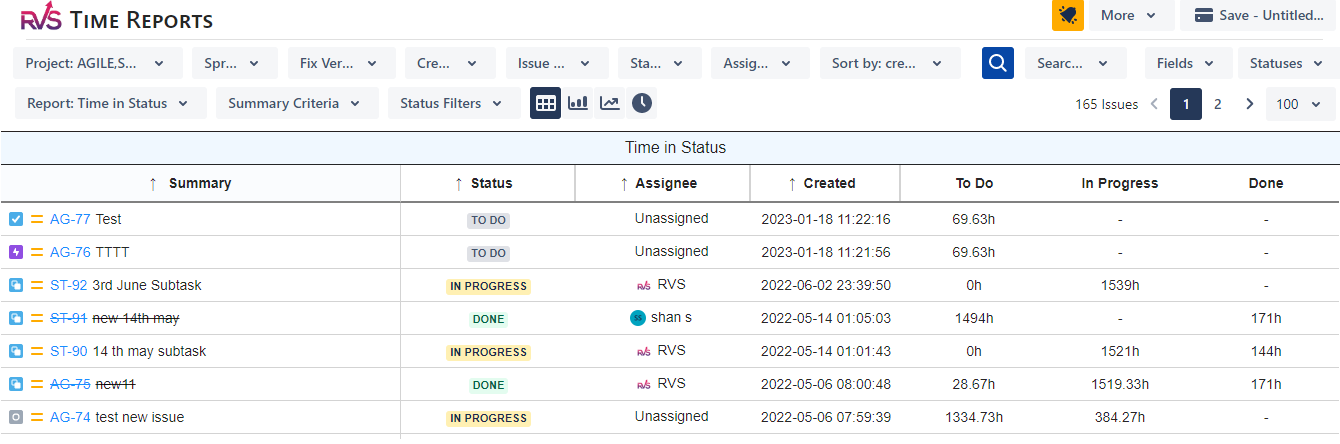
A sample report is as shown below
The report calculates the time taken by your filtered issues in each of the workflow status.
The time calculated is based on the working calendar as set by you in the app settings
Time in Status Count
Install Time in Status Reports app from the Atlassian Marketplace:
This report shows the number of times the issues in each status.
On the app screen
Search your issues with multiple filter options
Select the “Time in Status Count” report.
You can also add/remove fields from the report and also focus on time in specific statuses for your issues by selecting the desired ones from the Status dropdown.
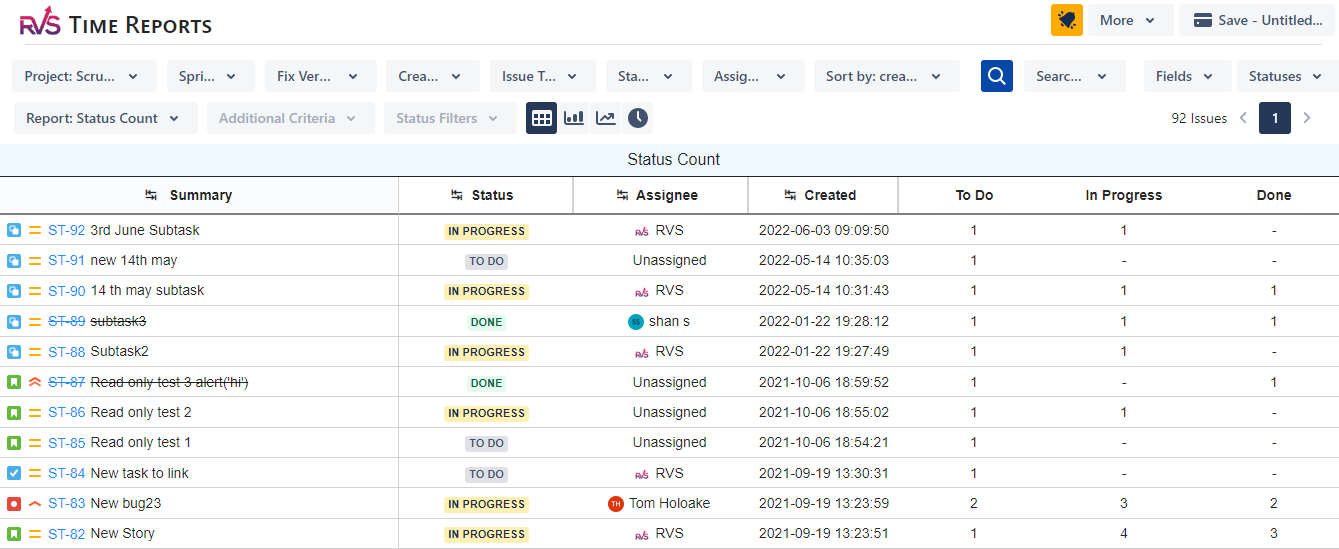
A sample report is as shown below
The report calculates the number of times your filtered issues went into each of the workflow status.
Time in Status per Time Grain
Install Time in Status Reports app from the Atlassian Marketplace:
This report shows the total time taken by the issues in each status for a date range.
On the app screen
Search your issues with multiple filter options
Select the “Time in Status per Time Grain” report.
You can also add/remove fields from the report and also focus on time in specific statuses for your issues by selecting the desired ones from the Status dropdown.
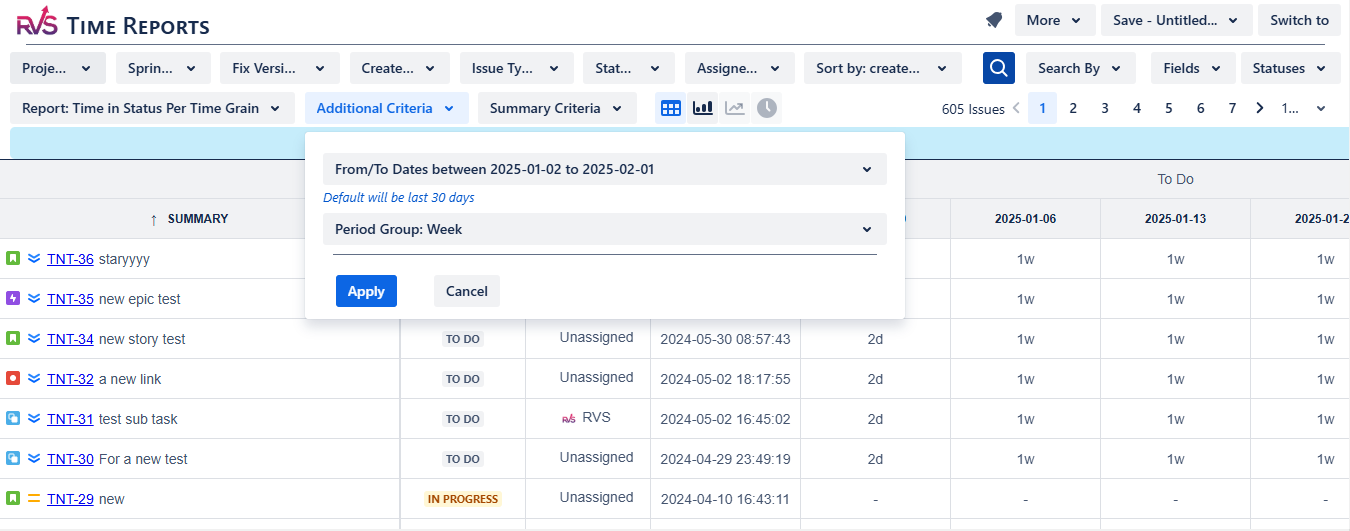
Select the date range from the “Additional Criteria” drop down
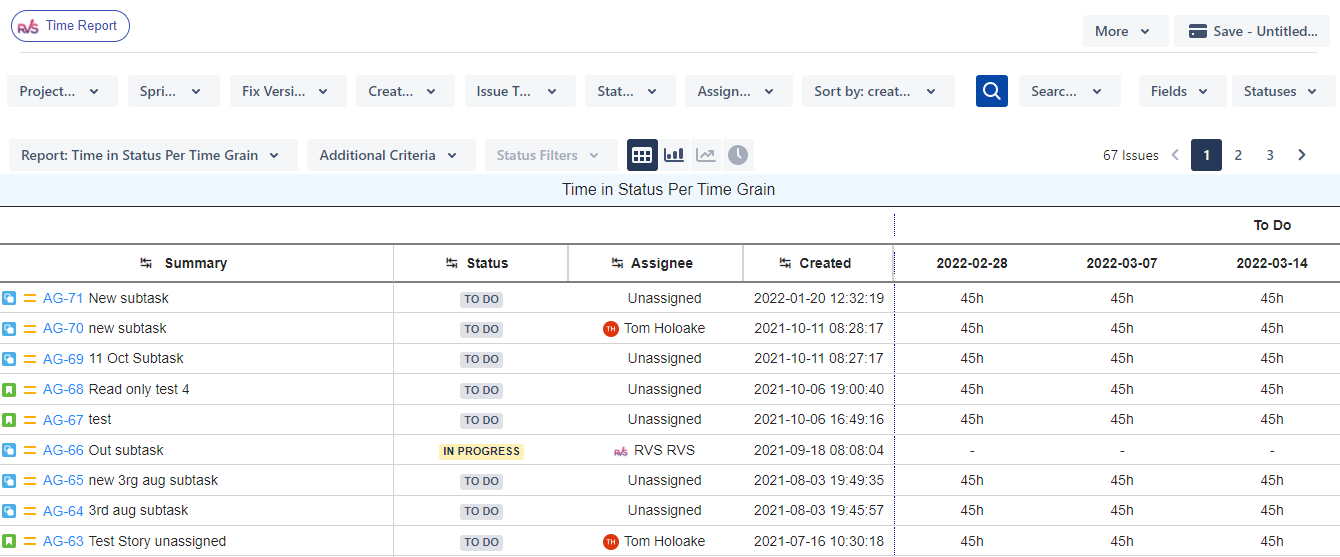
A sample report is as shown below
The report calculates the time taken by your filtered issues in each of the workflow status, within the date range selected
You can also group the date range by Days, Week or Month
The time calculated is based on the working calendar as set by you in the app settings
Time with Assignee
Install Time in Status Reports app from the Atlassian Marketplace:
This report shows the total time taken by the issues with each assignee.
On the app screen
Search your issues with multiple filter options
Select the “Time with Assignee” report.
You can also add/remove fields from the report and also focus on time in specific statuses for your issues by selecting the desired ones from the Status dropdown.
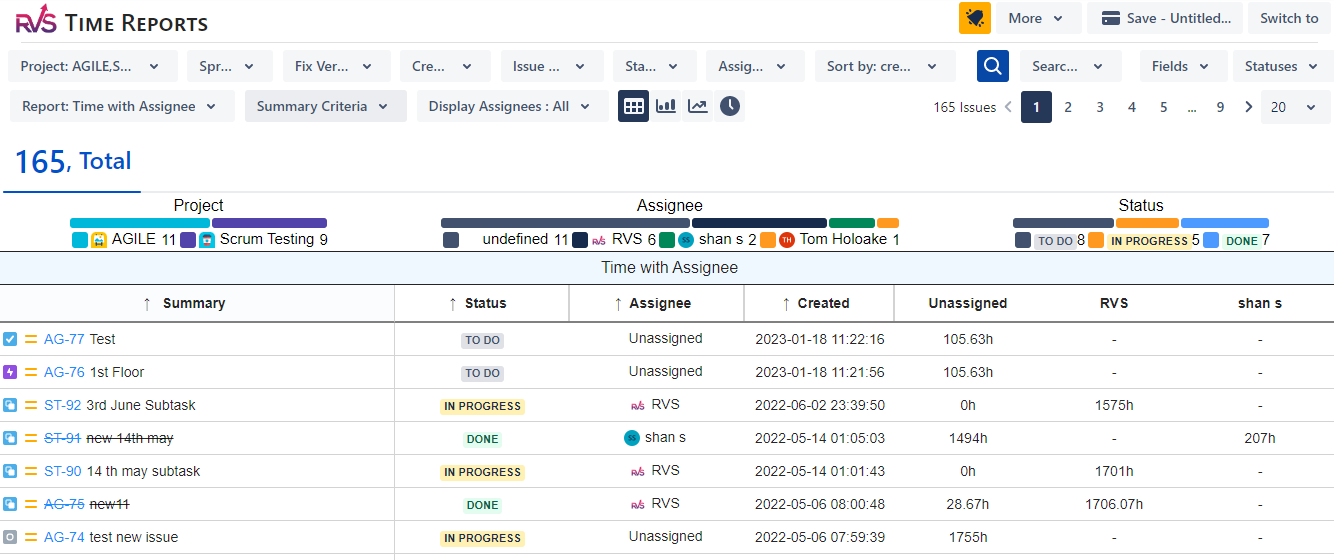
A sample report is as shown below
The report calculates the amount of time the filtered issues were with each assignee.
The time calculated is based on the working calendar as set by you in the app settings
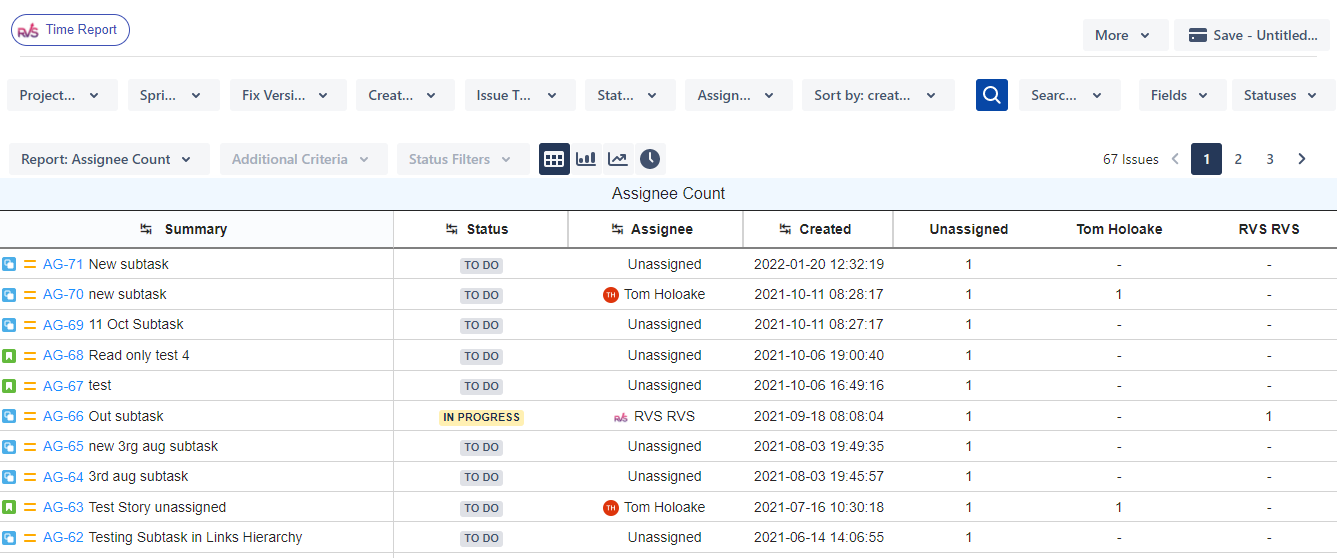
Time with Assignee Count
Install Time in Status Reports app from the Atlassian Marketplace:
This report shows the number of times the issue was with each assignee.
On the app screen
Search your issues with multiple filter options
Select the “Time with Assignee Count” report.
You can also add/remove fields from the report and also focus on time in specific statuses for your issues by selecting the desired ones from the Status dropdown.
A sample report is as shown below
The report show the number of times your filtered issues were with which assignee
Time with Assignee Per Time Grain
Install Time in Status Reports app from the Atlassian Marketplace:
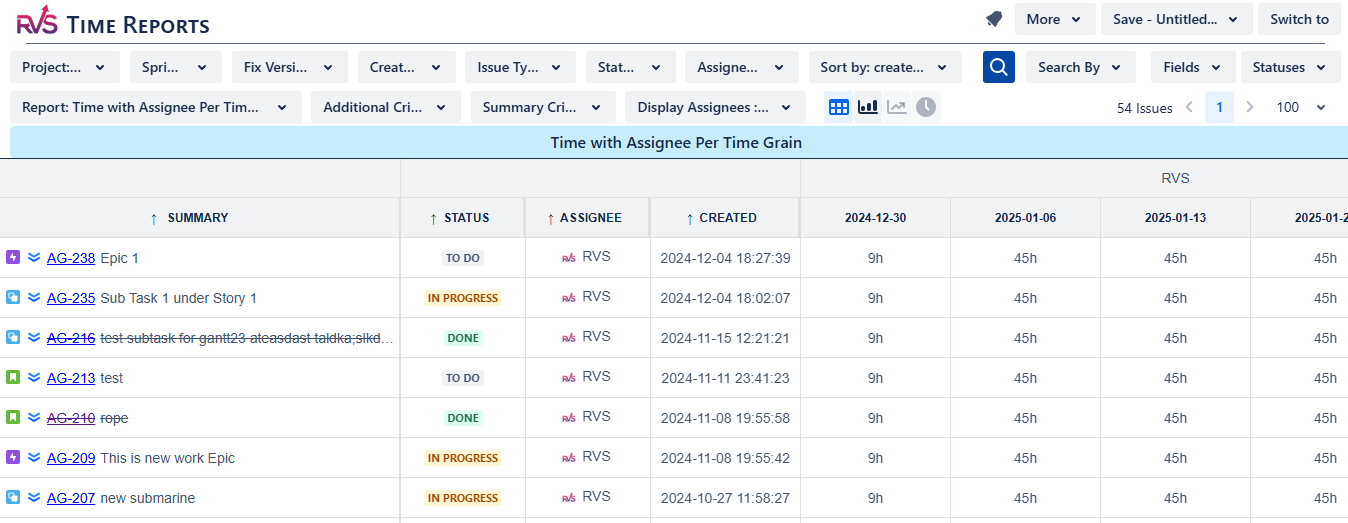
This report shows the total time taken by the issues with each assignee for a date range.
On the app screen
Search your issues with multiple filter options
Select the “Time with Assignee per Time Grain” report.
You can also add/remove fields from the report and also focus on time in specific statuses for your issues by selecting the desired ones from the Status dropdown.
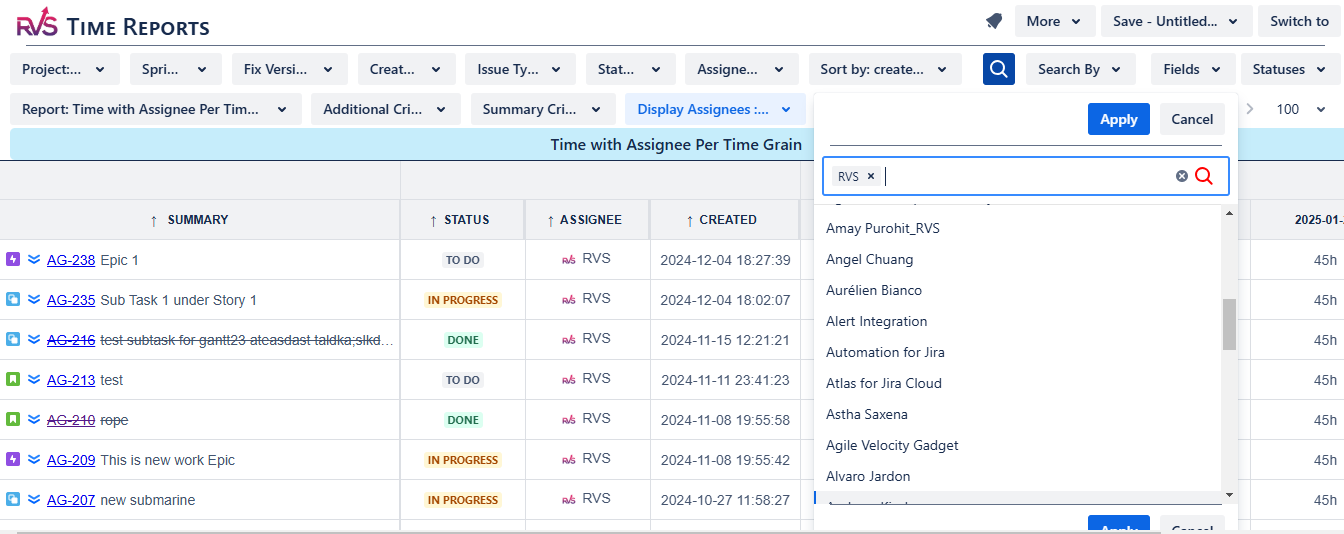
You can also add fields from the report and also focus on time with specific assigness for your issues by selecting the desired ones from the Assignee dropdown.
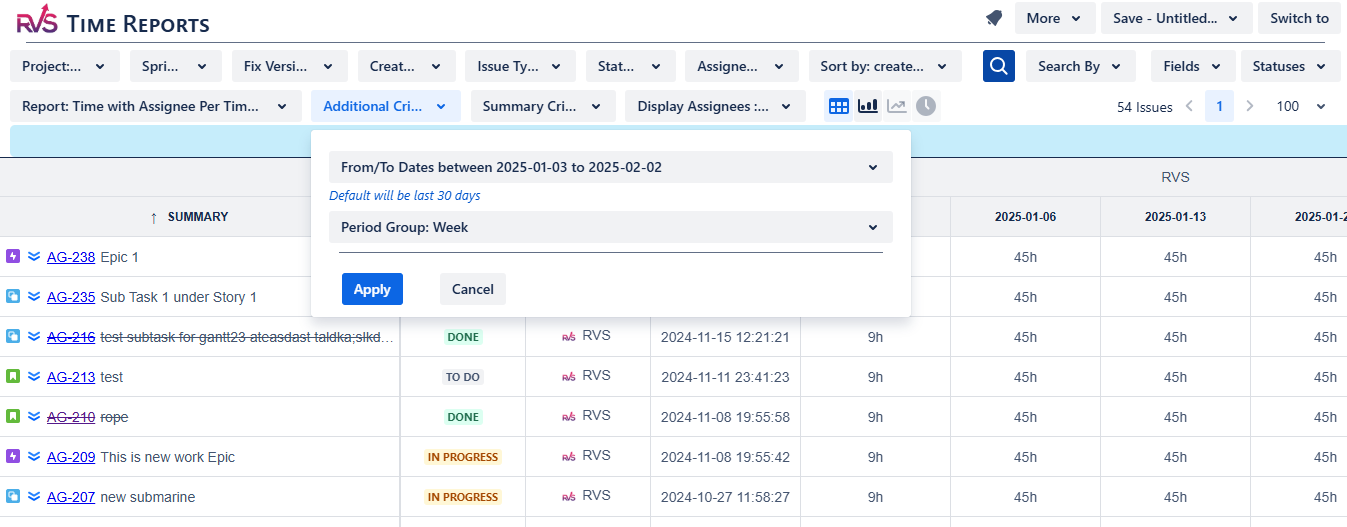
Select the date range from the “Additional Criteria” drop down
A sample report is as shown below
The report calculates the time taken by your filtered issues in each of the workflow status, within the date range selected
You can also group the date range by Days, Week or Month
A sample report is as shown below
The report calculates the time taken by your filtered issues in each of the workflow status.
The time calculated is based on the working calendar as set by you in the app settings
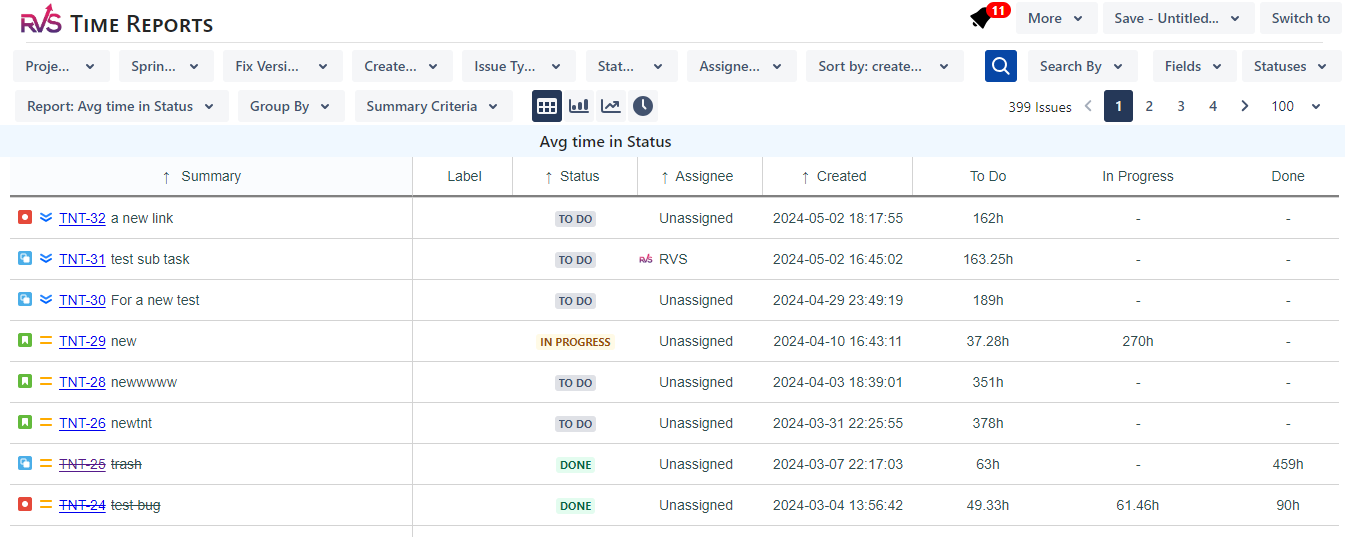
Average Time in Status
Install Time in Status Reports app from the Atlassian Marketplace:
This report shows the average time taken by the issues in each status.
On the app screen
Search your issues with multiple filter options
Select the “Avg Time in Status” report.
You can also add/remove fields from the report and also focus on time in specific statuses for your issues by selecting the desired ones from the Status dropdown.
Time between Status Transitions
Install Time in Status Reports app from the Atlassian Marketplace:
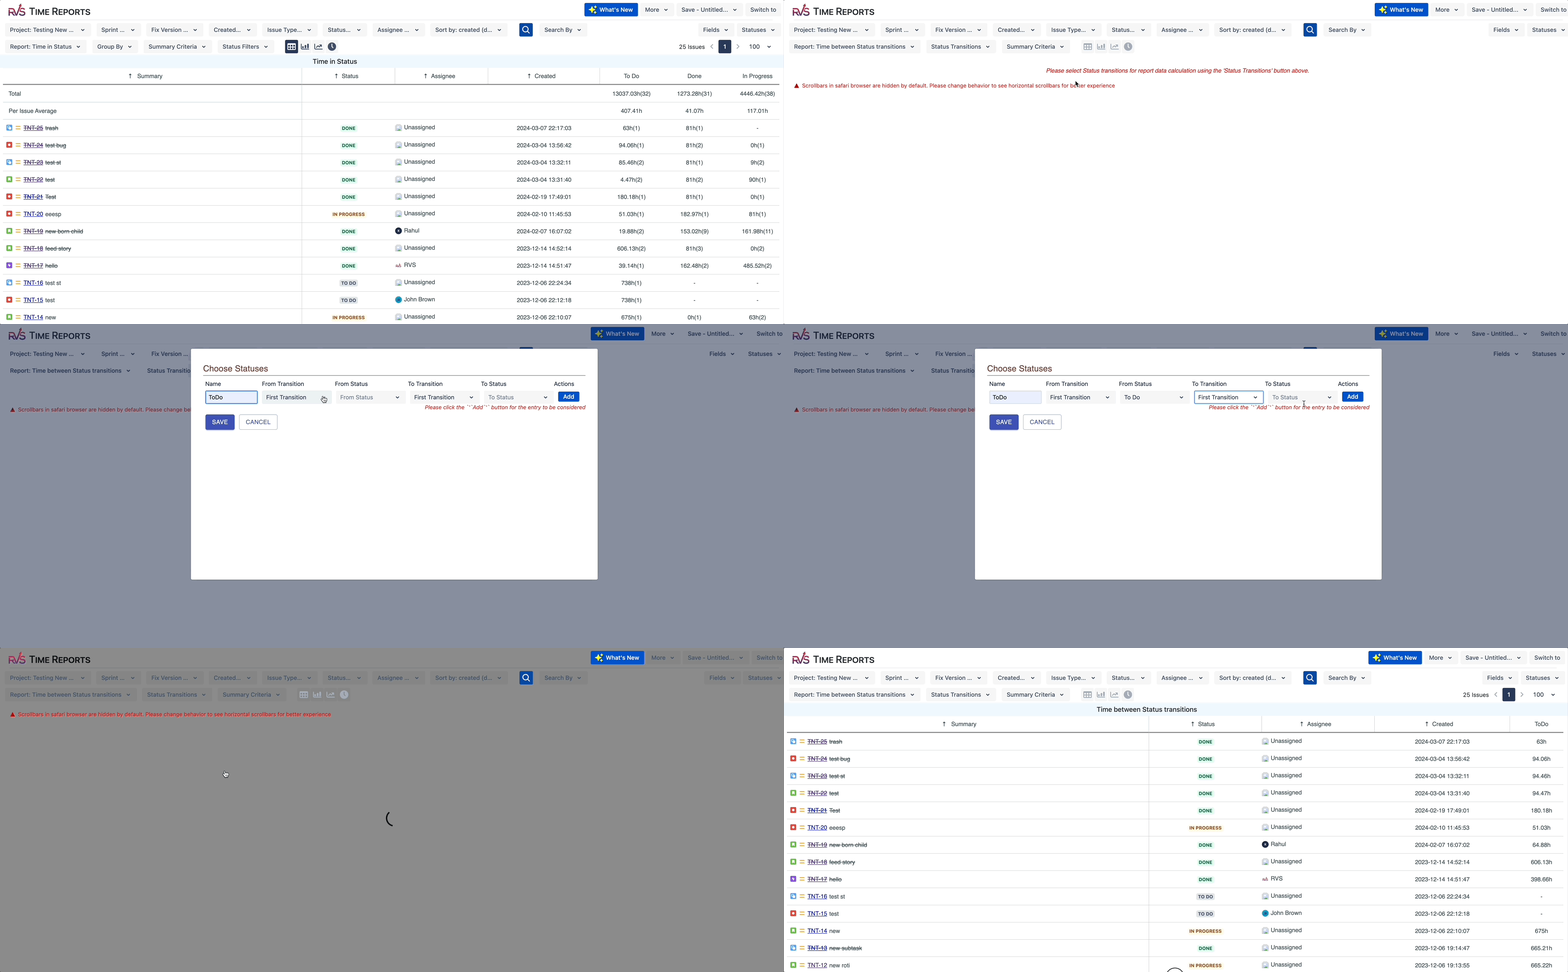
This report shows the total time taken by the issues between two statuses.
On the app screen
Search your issues with multiple filter options
Select the “Time between Status Transitions” report.
Once you select this report type, choose the statuses from “Status Transitions” drop down as shown below.
Recent Time in Status
Install Time in Status Reports app from the Atlassian Marketplace:
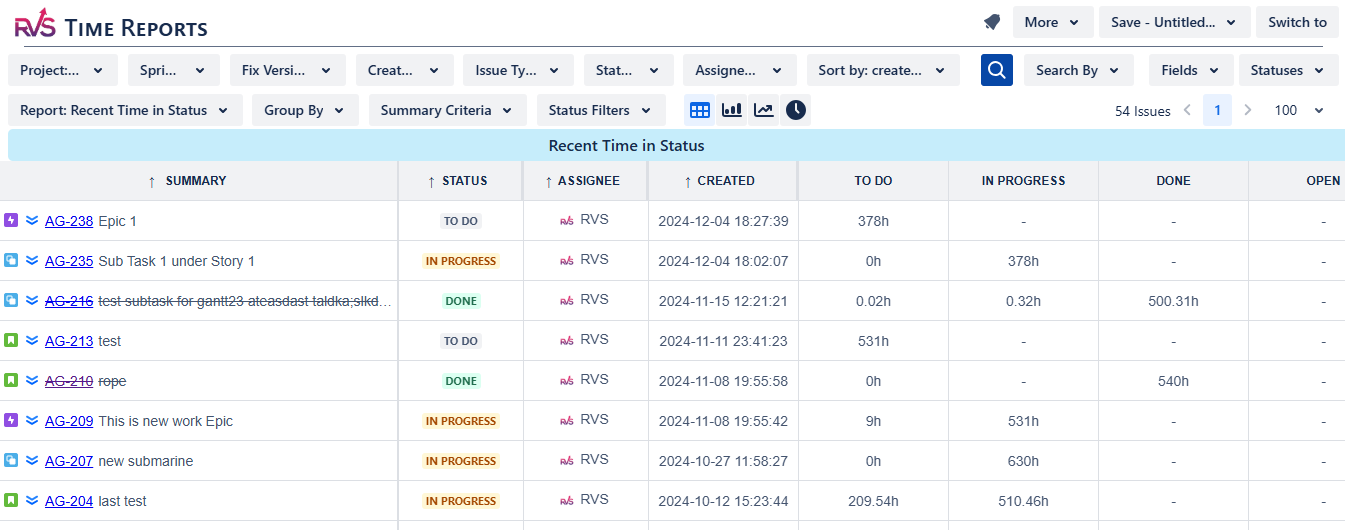
This report shows the total time taken by the issues in their last status.
On the app screen
Search your issues with multiple filter options
Select the “Recent Time in Status” report.
You can also add/remove fields from the report and also focus on time in specific statuses for your issues by selecting the desired ones from the Status dropdown.
Time in Field
Install Time in Status Reports app from the Atlassian Marketplace:
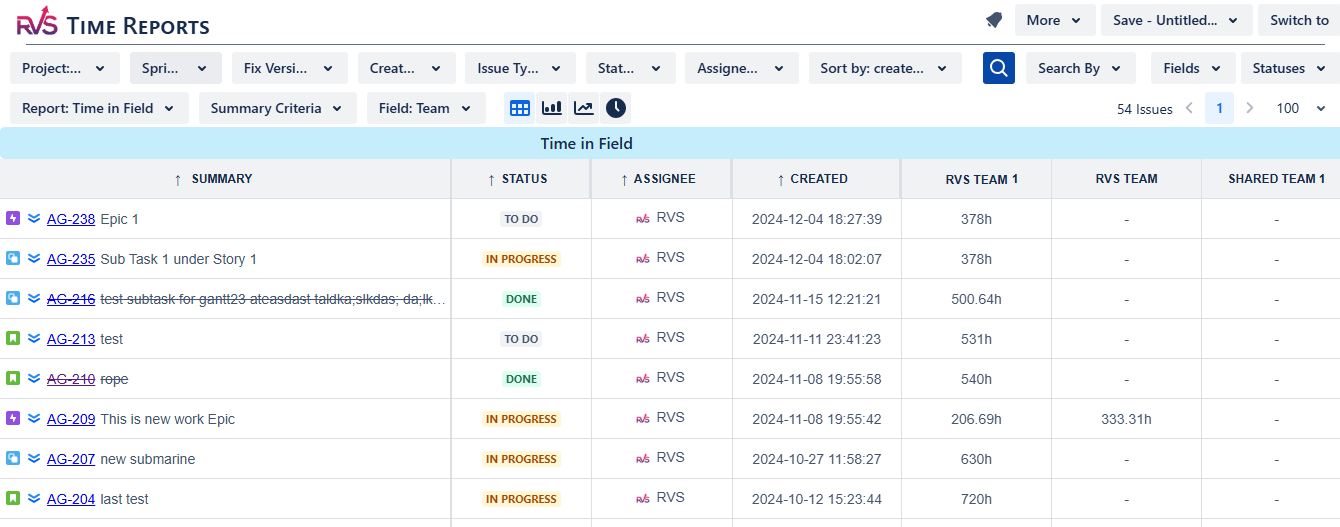
This report shows the total time taken by the issues in a custom field.
On the app screen
Search your issues with multiple filter options
Select the “Time in field” report.
In the example below, the report shows time the issues have spent with a particular team. You can vie time with any other custom field as well by selecting from the “Field” drop down.
You can also add/remove fields from the report and also focus on time in specific statuses for your issues by selecting the desired ones from the Status dropdown.
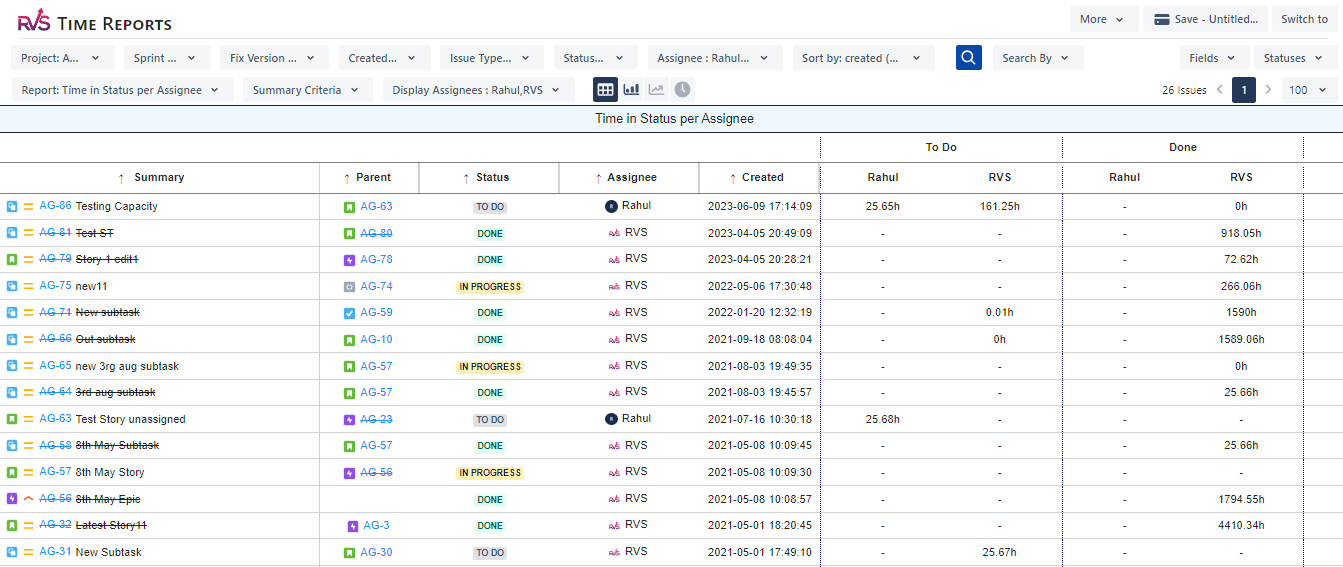
Time in Status per assignee
Install Time in Status Reports app from the Atlassian Marketplace:
This report shows the total time taken by the issues in each status with each assignee.
On the app screen
Search your issues with multiple filter options
Select the “Time in Status per assignee” report.
This is a more granular report to track the various statuses the issues have gone through and in those statuses they were with which assignee.
You can also add/remove fields from the report and also focus on time in specific statuses for your issues by selecting the desired ones from the Status dropdown.
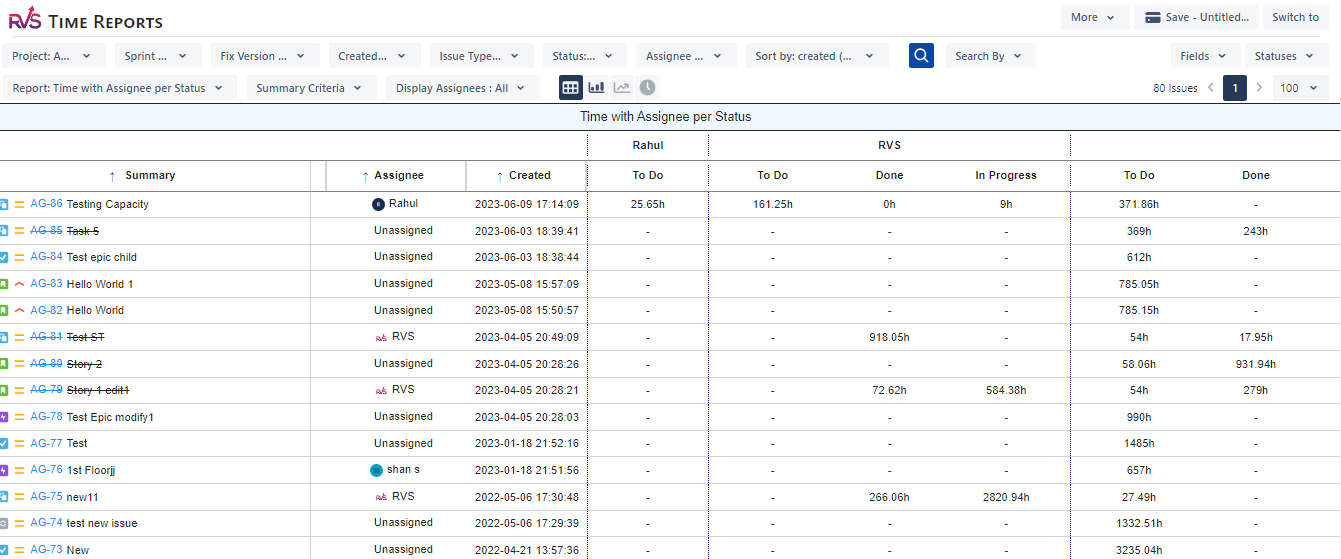
Time with Assignee per Status
Install Time in Status Reports app from the Atlassian Marketplace:
This report shows the total time taken by the issues with each assignee and in each status with them.
On the app screen
Search your issues with multiple filter options
Select the “Time with assignee per Status” report.
This is a more granular report to track the various assignees the issues have gone through and in which statuses when they were with each assignee.
You can also add/remove fields from the report and also focus on time in specific statuses for your issues by selecting the desired ones from the Status dropdown.
Transition Reports
Status Transition Count
Status Transition Dates
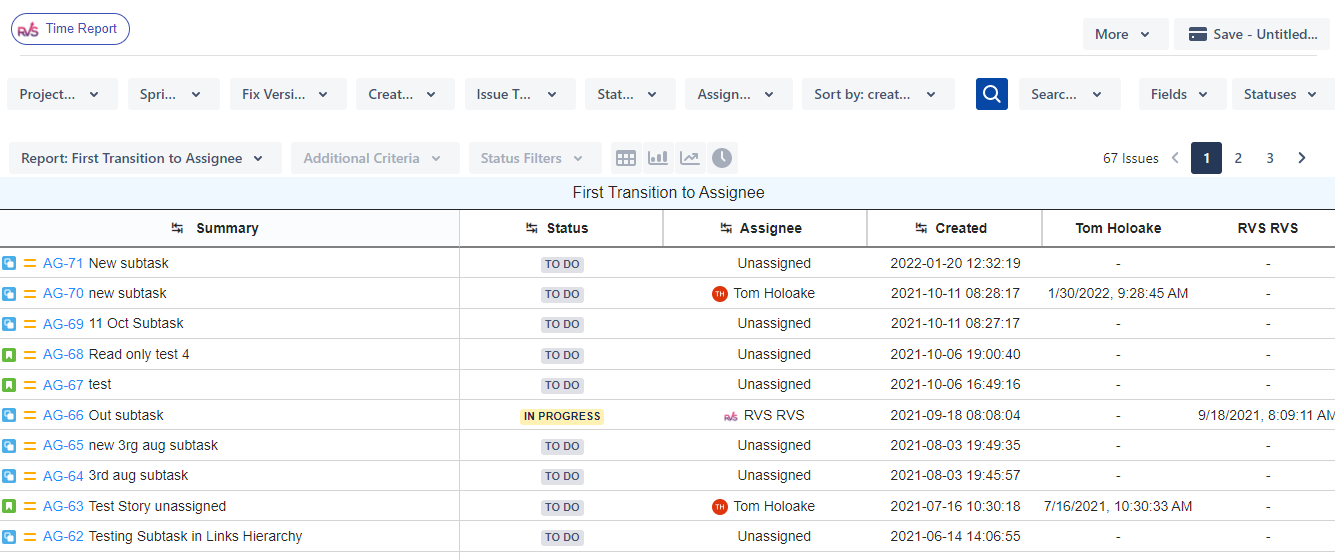
First Transition To Assignee
Last Transition to Assignee
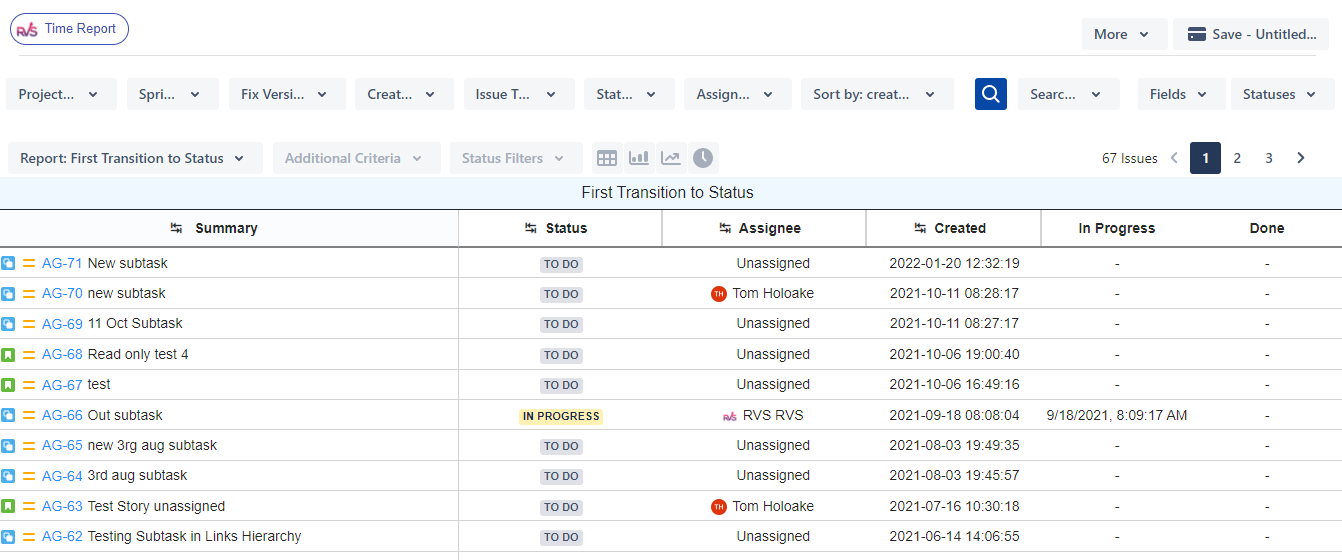
First Transition to Status
Last Transition to Status
First Transition from Assignee
Last Transition from Assignee
First Transition from Status
Last Transition from Status
Status Transition Count
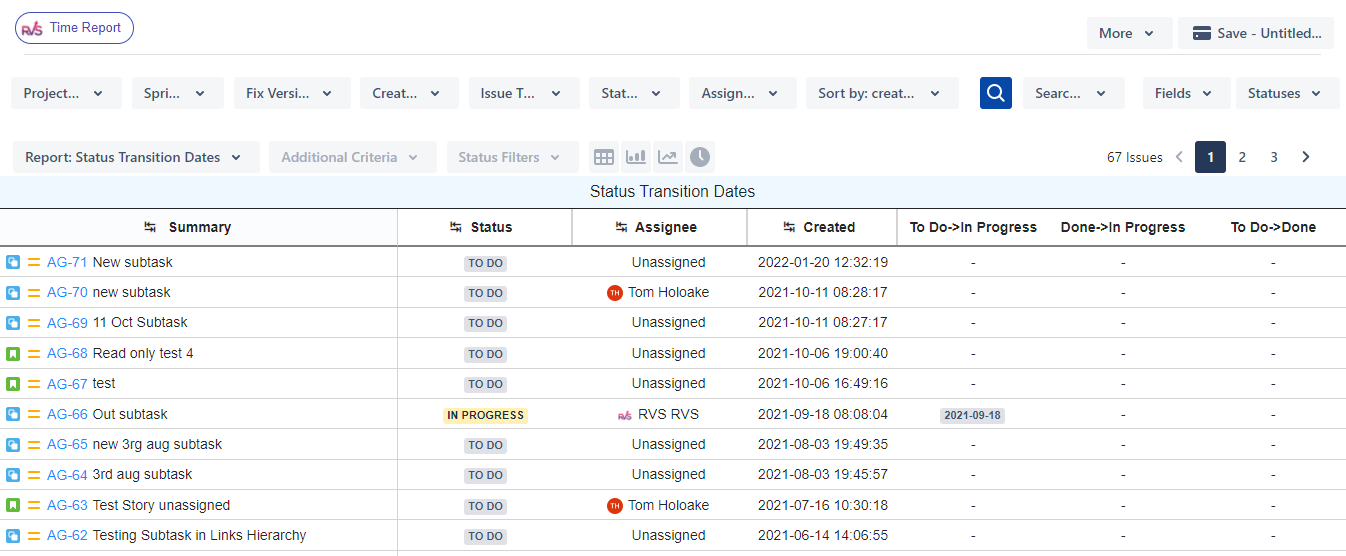
Median, 85th Percentile Reports
Install Time in Status Reports app from the Atlassian Marketplace:
This report shows the median time taken by the issues in each status.
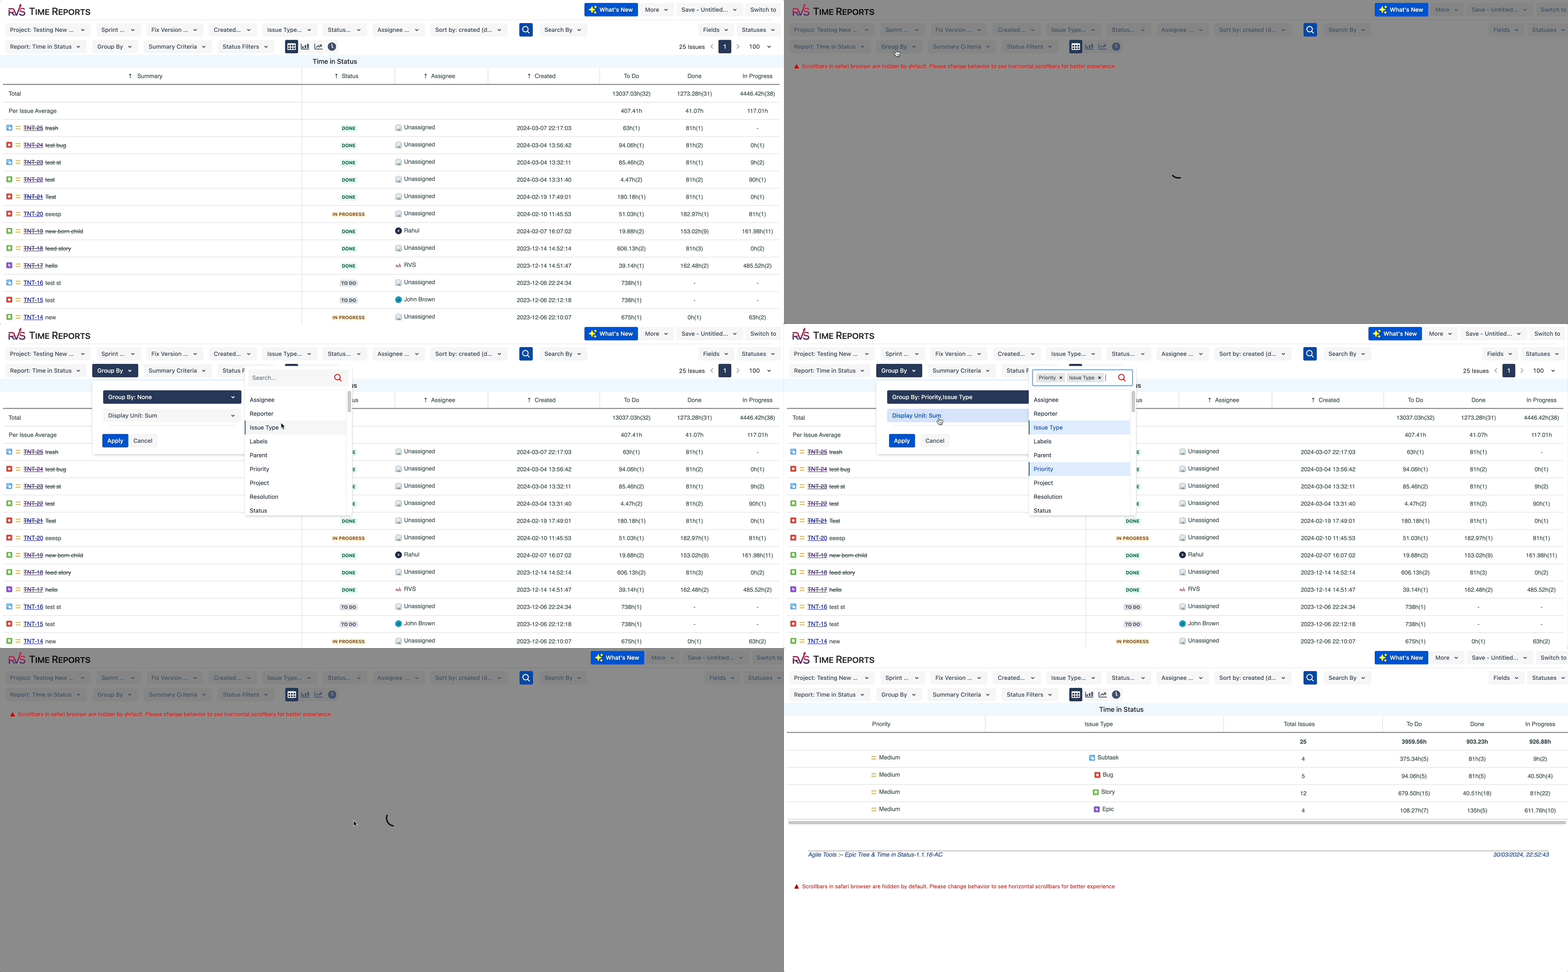
Time in Status Trends Analysis
You can also add/remove fields from the report and also focus on time in specific statuses for your issues by selecting the desired ones from the Status dropdown.
TIS Dashboard Gadgets
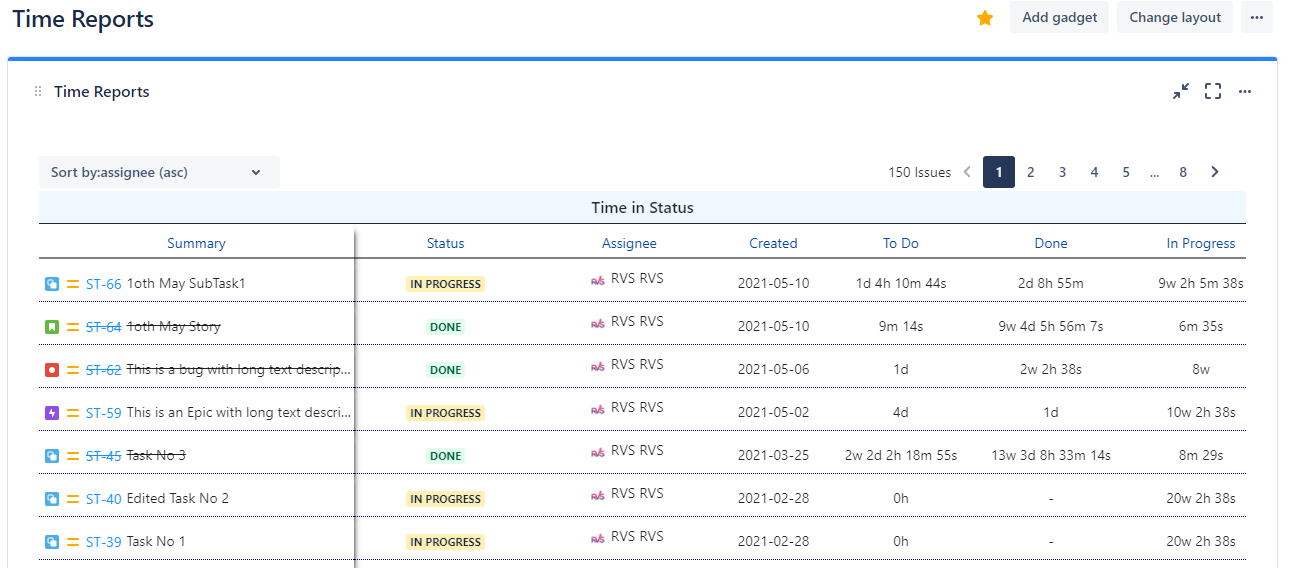
Dashboard Gadgets can be added on Dashboards by clicking on Dashboards → <Your Dashboard Name> → Add Gadget. In the “Add a Gadget PopUp”, search for Votazz and it will show all the available gadgets which can be added.
Time Reports Gadget Configuration
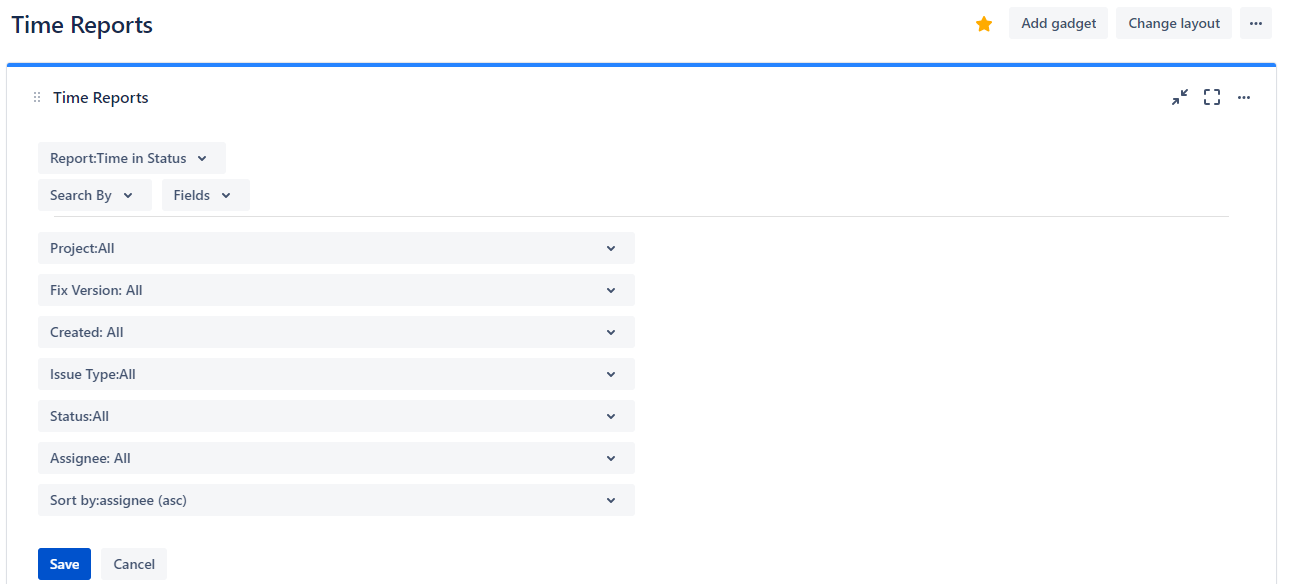
Time Reports Gadget
Check time in status of an issue on Issue screen
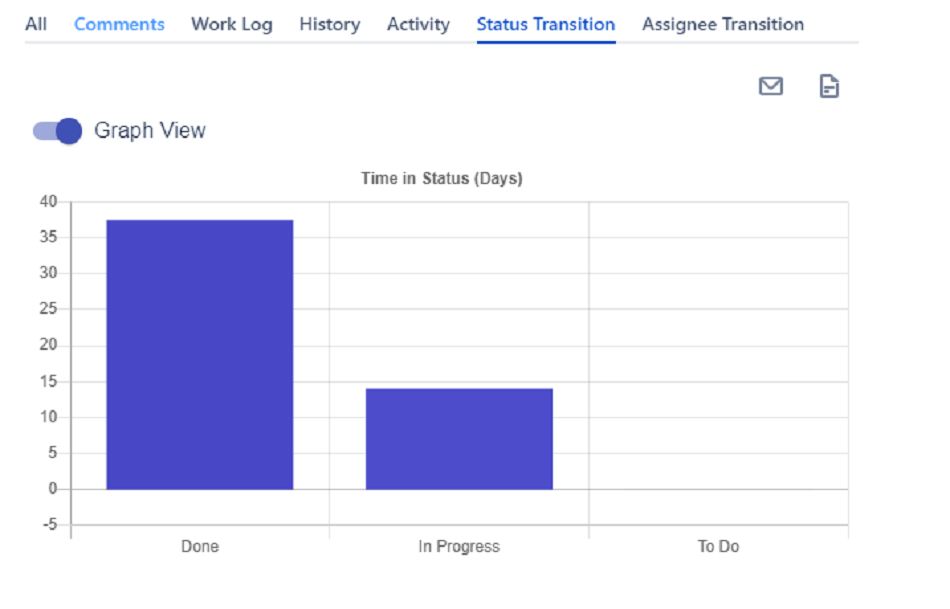
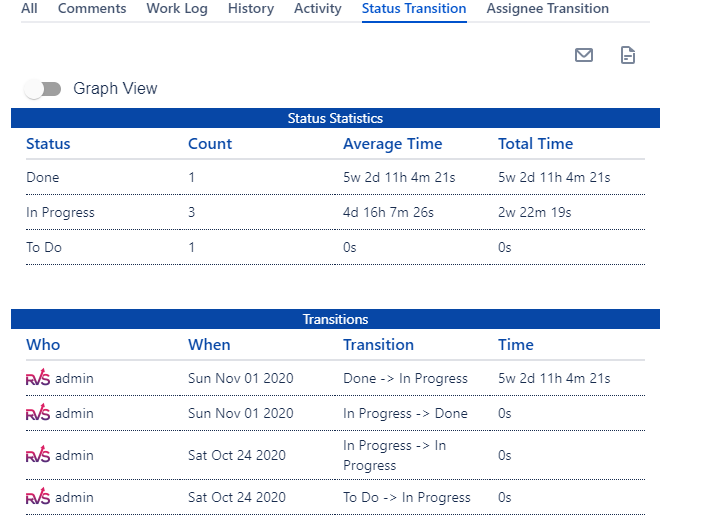
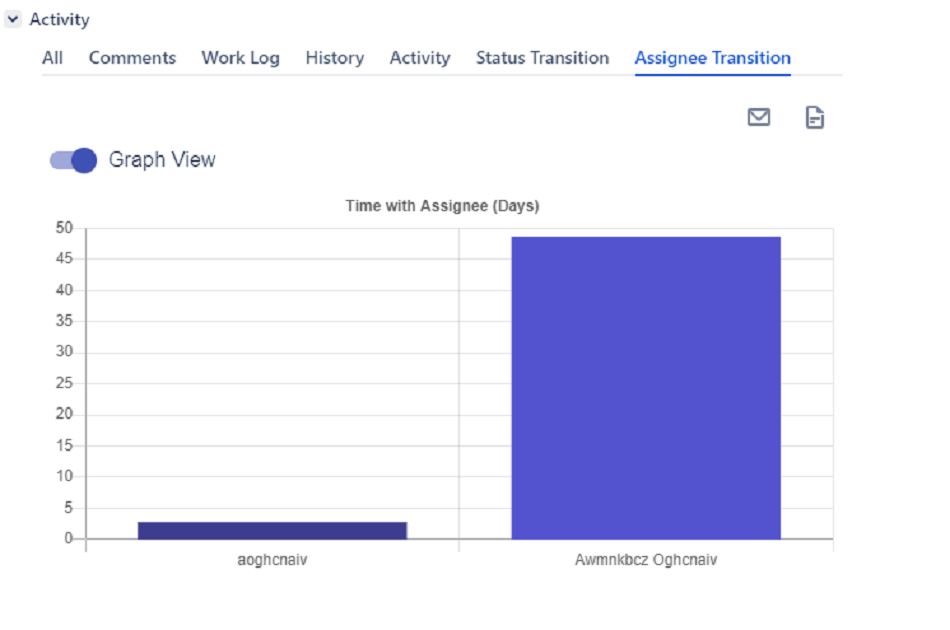
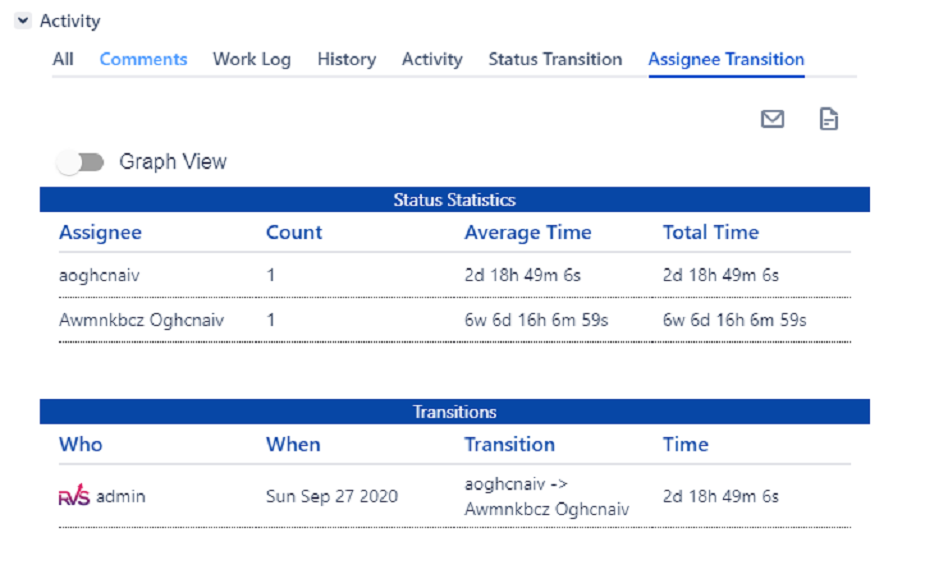
Time in Status Reports app helps to view complete transitions of an issue with addition of following tabs on the issue screen
· Status Transition : View all the status changes in a single tab along with average time and count in each status. Switch between graphical and tabular view to make more out of the data.
· Assignee Transition : View all the assignees for the issue along with the time for which the issue was with each assignee. Switch between graphical and tabular view to make more out of the data.
·
Settings
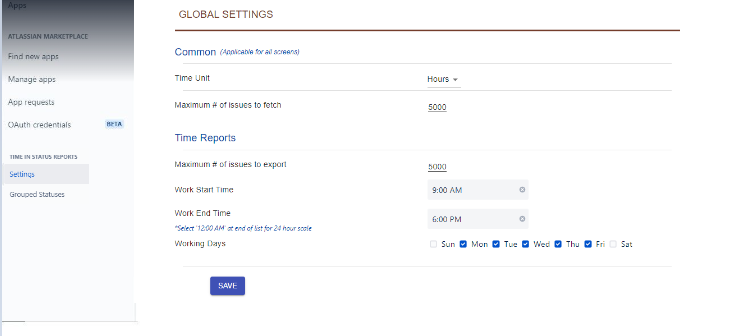
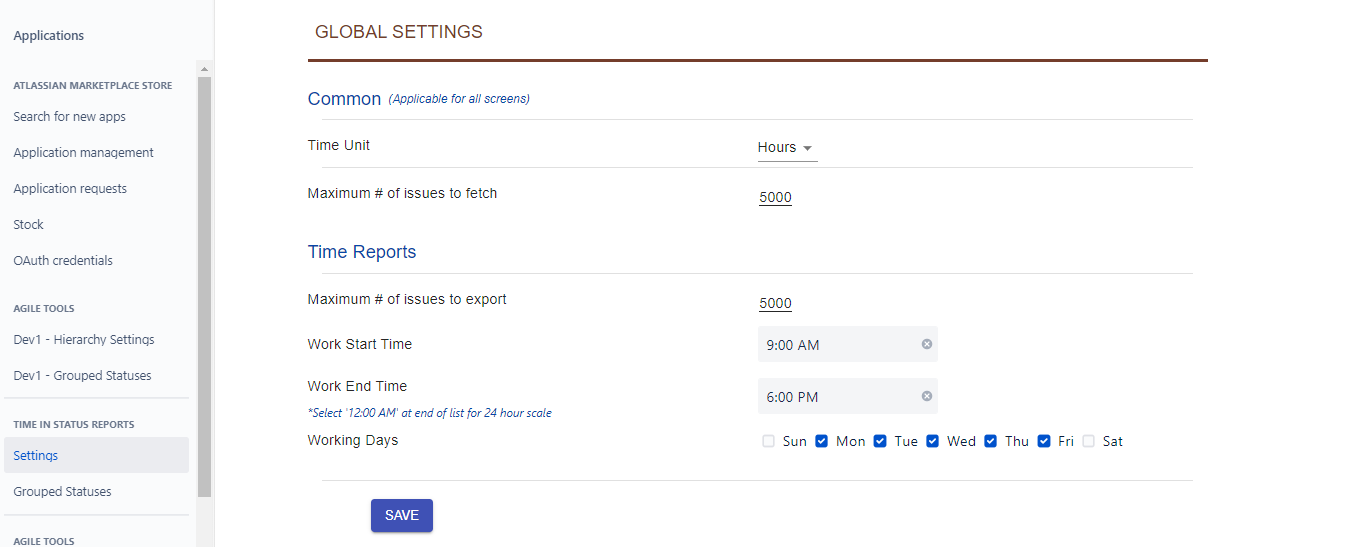
Settings for can be configured at two places:
1. Global Settings : Requires Jira admin privileges.
a. Jira Server / Data Center: Navigate to Settings → System page. You will find Time in Status Reports → Settings link on the left navigation bar, as per screen shot below.
2. Jira Cloud : Navigate to Settings → Apps page. Time in Status Reports → Settings link on the left navigation bar, as per screen shot below.
2. User Level Settings : User can override Global Settings, by changing the settings from any of the app pages by clicking on “More - Settings” as below. The settings are per user and are cached locally on each user’s machine.
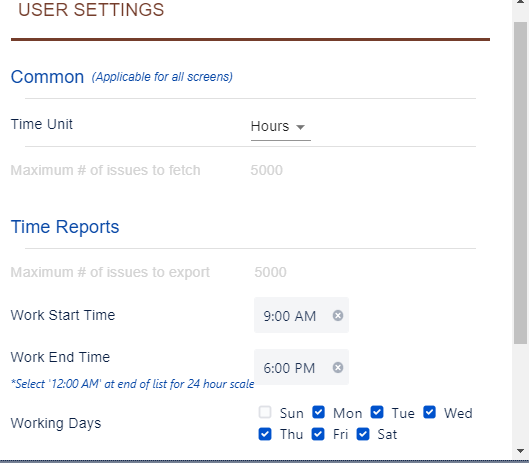
The below settings can be changed :
Common : The time unit display on all the reports can be changed from here to either hours/days/default.
3. Time Reports : You can configure the working days in a week and your working hours from this setting.
Also the number of issues which can be exported to Excel can be set from here. The max number allowed
is 5000.
Grouped Statuses
You can group your Statuses to define your own Cycle time, Lead time or any other grouping.
The app will sum up the time in each of the statuses which are grouped together.
Jira Server / Data Center: Navigate to Settings → System page. You will find Time in Status Reports → Grouped Statuses link on the left navigation bar,
Cloud: Navigate to Settings → Apps page. You will find Time in Status → Grouped Statuses link on the left navigation bar, as per screen shot below.
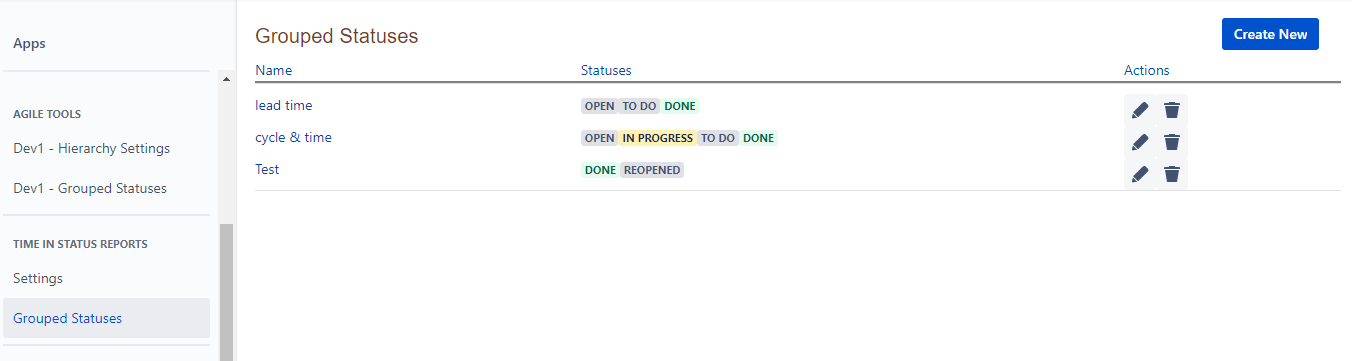
Click on “+” sign on top right to add a Status group. Click on “Save” icon after you are done.
You can use this grouped status on the Time in Status Report screen as below.
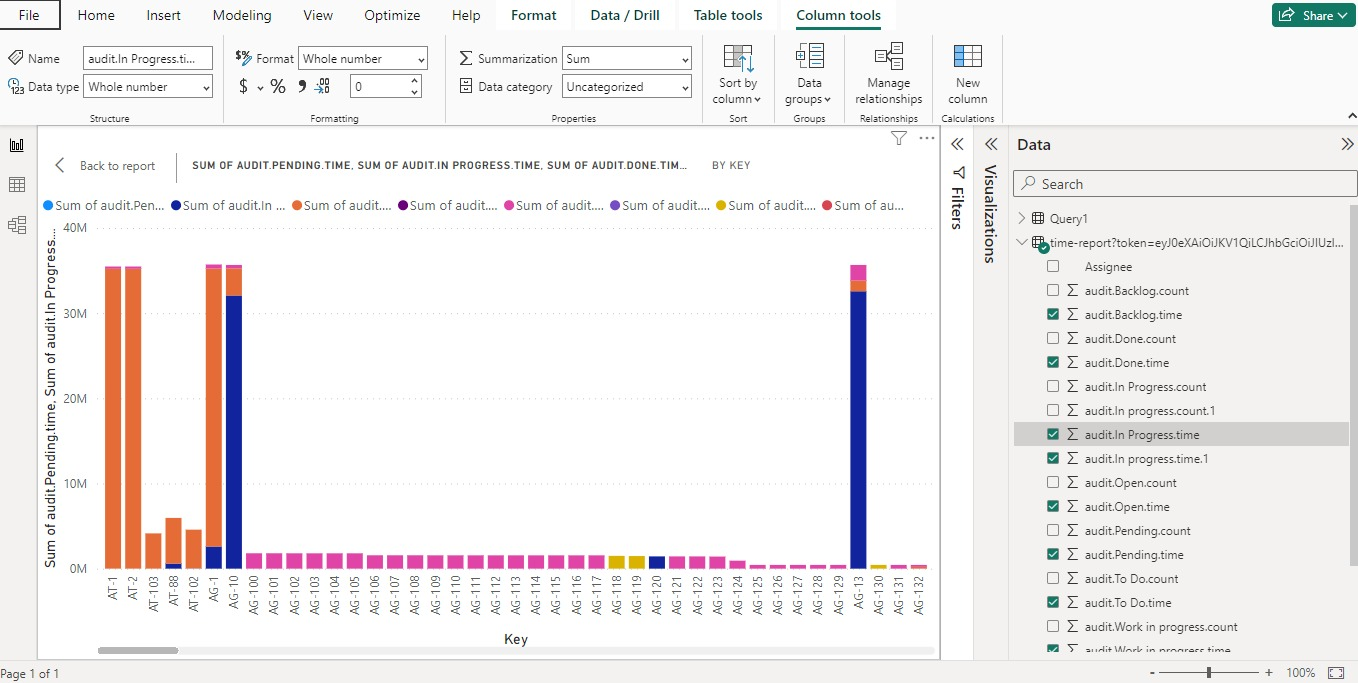
JSON Feed for Export to Power BI and other Tools
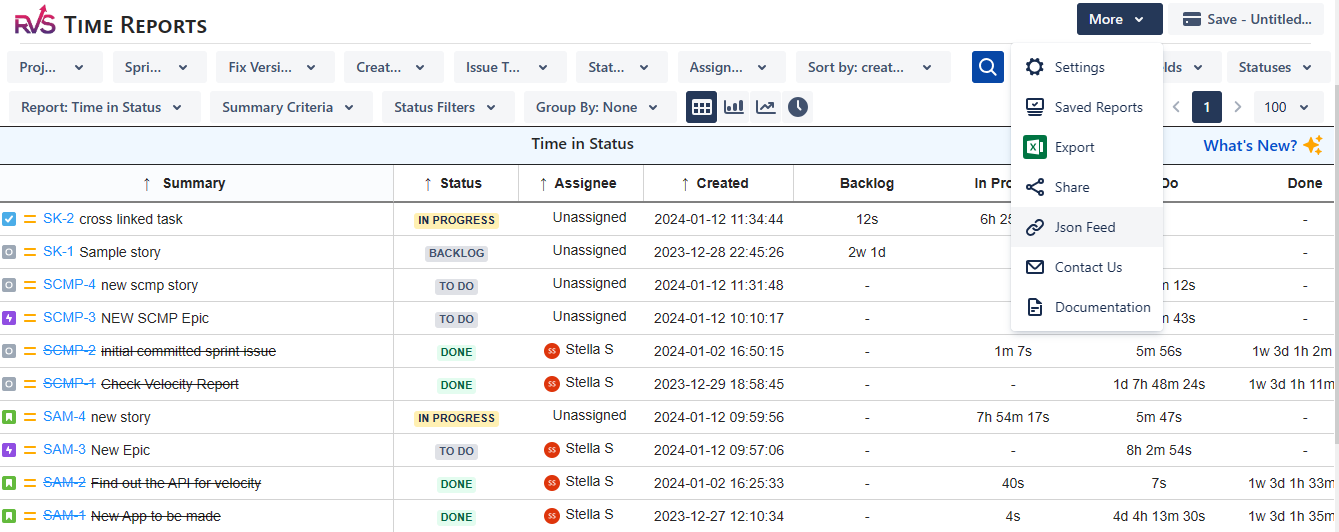
You can easily export your time in status reports to Power BI and other BI tools using the JSON Feed feature.
On the app screen, click on “More” → “JSON Feed” and copy the feed url.
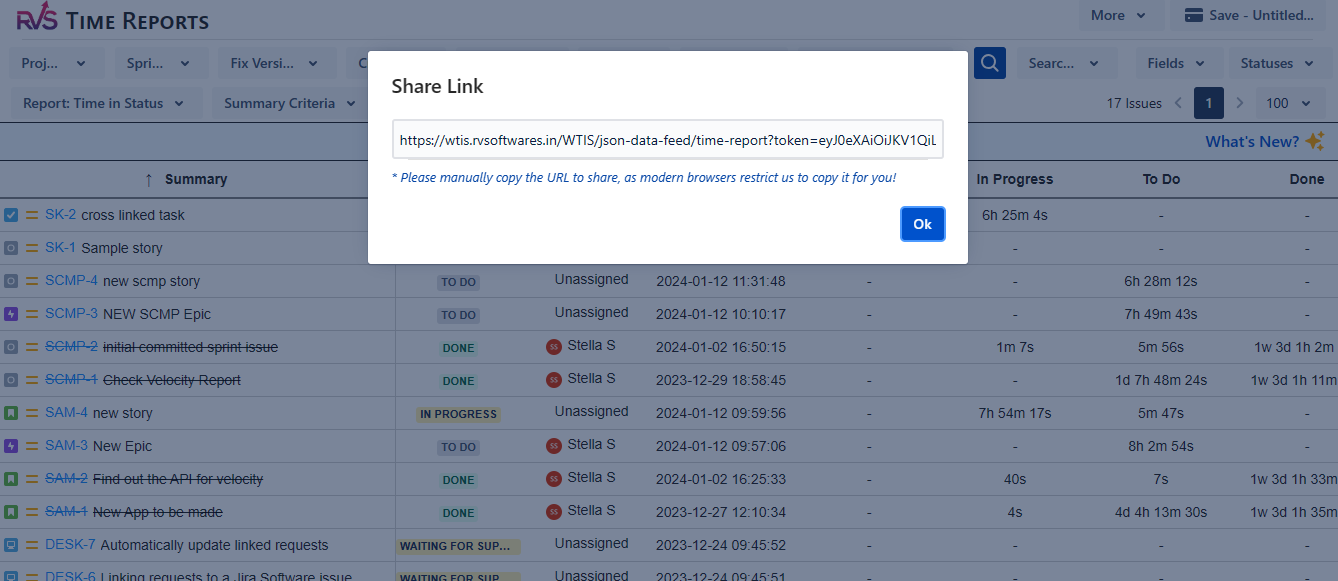
In Power BI, use the "Web" connector to connect to the JSON feed.
Enter the URL copied above, and once connected, you can use Power BI's capabilities to create reports and dashboards based on your Jira data.
Sample report below
Security
The Data Feed feature uses JSON Web Tokens (JWT) for authentication. A JSON Web Token (JWT) in Jira is a secure way to authenticate and authorize access to APIs.
During server-side authentication with JWT, the system verifies the token's validity. If the provided token is invalid, the request will be denied as unauthorized.
JWT data is limited to identifiers and does not include any personal information.
Each token is generated when the JSON Data Feed link is created. It is unique, does not expire and is valid for 12 hours.
Sample JSON for “Time in Status” report
[
  {
    "Issue": "Test Burndown up",
    "Status": "To Do",
    "Assignee": "Unassigned",
    "Created": "2025-01-05 10:50:54",
    "Key": "AG-255",
    "audit": {
      "To Do": {
        "time": 380940,
        "count": 2
      },
      "Done": {
        "time": 125,
        "count": 1
      },
      "In Progress": {
        "time": 0,
        "count": 0
      },
      "Open": {
        "time": 0,
        "count": 0
      },
      "In progress": {
        "time": 0,
        "count": 0
      }
    }
  },
  {
    "Issue": "check is association",
    "Status": "To Do",
    "Assignee": "Unassigned",
    "Created": "2024-12-25 11:22:52",
    "Key": "AG-254",
    "audit": {
      "To Do": {
        "time": 631693,
        "count": 1
      },
      "Done": {
        "time": 0,
        "count": 0
      },
      "In Progress": {
        "time": 0,
        "count": 0
      },
      "Open": {
        "time": 0,
        "count": 0
      },
      "In progress": {
        "time": 0,
        "count": 0
      }
    }
  }
  ]
Frequently Asked Questions
What is the "Time in Status Reports" app for Jira?
The "Time in Status Reports" app for Jira helps you track the amount of time that issues spend in different statuses during their lifecycle. It provides reports and visualizations to help teams understand bottlenecks, workflow efficiency, and individual performance.
How do I install the "Jira Time in Status Reports" app in Jira?
To install the Jira Time in Status app in Jira, follow these steps:
Go to Jira Settings > Apps.
Click on Find new apps in the Atlassian Marketplace.
Search for "Time in Status Reports" by Votazz and select the appropriate app.
Click Install and follow the on-screen instructions.
What kind of reports can I generate with "Time in Status Reports in Jira"?
The app allows you to generate 20 + various reports, including:
Jira Time in Status: Shows the time spent by each user in each status.
Time with Assignee: Tracks time spent with each assignee.
Status Count : Displays how many times each issue went into each status.
Average Time in Status: Helps measure the average time spent in each status across different issues.
and many more...
Can I customize the time tracking settings in the app?
Yes, you can customize several aspects of the time tracking, including:
-> Time Units: You can set time units to display in hours, minutes, or days.
-> Filter Criteria: Adjust filters to specify which issues, projects, or teams you want to include in reports.
-> Date Range: Set date ranges to track time spent in statuses within specific periods.
-> Calendar: Set the working calendar of your team to calculate time in status only for your working days and times.
Is the "Jira Time in Status Reports" app compatible with Jira Cloud and Jira Data Center?
Yes, the "Jira Time in Status Reports " app is available for both Jira Cloud and Jira Data Center, although installation steps may differ slightly between the two platforms. Always check the version compatibility for your Jira instance before installing.
Can I get time reports for closed or resolved issues?
Yes, you can generate reports for closed or resolved issues, provided the issues were tracked through the workflow statuses. Ensure that the report filters are set to include closed or resolved issues, and the data will reflect the time spent in each status before they were closed.
How can I analyze workflow bottlenecks using "Jira Time in Status"?
To analyze bottlenecks:
Generate a report of Average Time in Status for your issues.
Look for statuses where issues spend significantly more time than others.
Investigate those statuses to identify workflow inefficiencies, such as lack of resources or unclear process steps.
Does the app track time spent in custom statuses?
Yes, "Jira Time in Status Reports" app tracks time spent in custom statuses as well. As long as the custom statuses are part of your Jira workflow, the app will monitor and report on time spent in each of them.
How can I share Jira Time in Status reports with my team?
You can export reports in formats like CSV or Excel and share them with your team. Alternatively, you can generate links to the reports within Jira and share them via email or internal communication channels.
Does the app integrate with other Jira apps or tools?
Yes, the "Jira Time in Status" app can integrate with various Jira apps and tools like Jira Software, Jira Service Management, and Jira Cloud. Additionally, it supports integration with third-party apps like Power BI, Google Sheets etc for advanced reporting and dashboards.
Help & Support
Please raise a support request here, or email us at support@votazz.co.
To help us respond quickly and accurately, include the app version, your Jira version, your browser, and the steps to reproduce the issue with examples or screenshots.