Issue Hierarchy Structure
Issue Hierarchy Structure shows a Jira project's issue hierarchy as a nested tree — Epic → Story → Sub-task, issue-link chains such as “is parent of”, and Advanced Roadmaps levels above Epics — with time estimates, story points and percentage complete summed up at every level.
Reports are available on the app screen, on the issue view, and as dashboard gadgets, and can be exported to CSV.
Access Issue Hierarchy
Cloud Edition :
Open “Apps” from your top Navigation bar. You will find “IH - Epic Hierarchy”, “IH - Links Hierarchy” submenus. Please click as per you need.
Epic Hierarchy Reports
Clicking on “Epic Hierarchy” will navigate to the below screen. Select a Project from the drop down. Either click on “Search” button to load all the epics of the project or select a fix version/created date/status/assignee and load its details. The report will show rolled up estimates (time/story points progress) at epic level for all the issues in the epic.
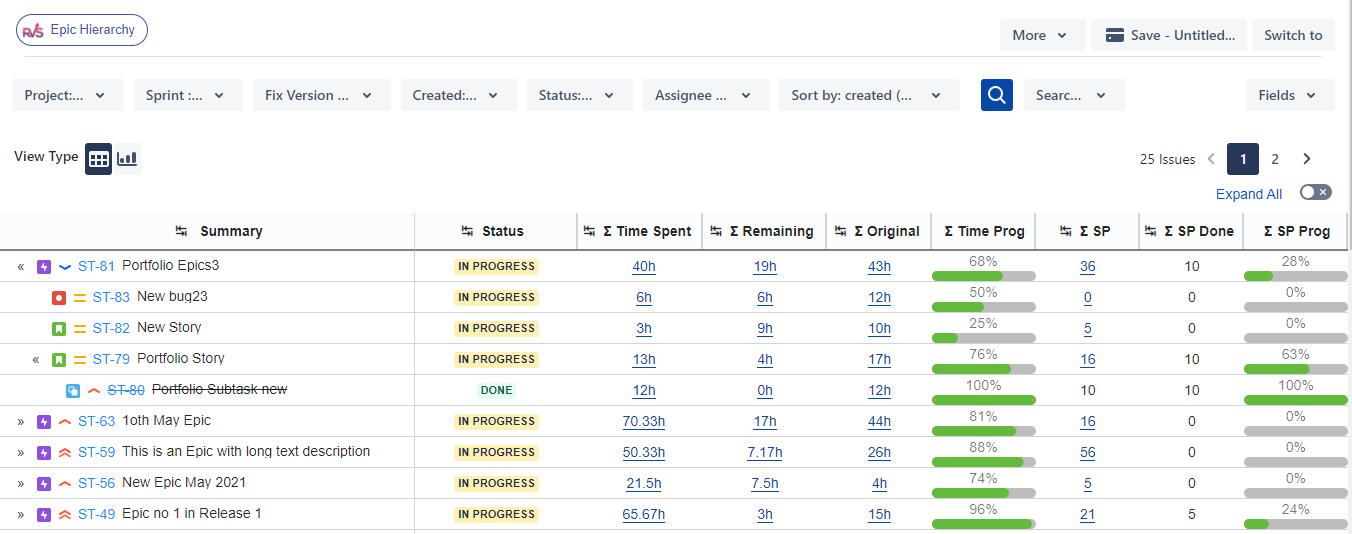
Edit Issue Summary, Status, Assignees, Estimates, Story points and lot more right on the Hierarchy report.
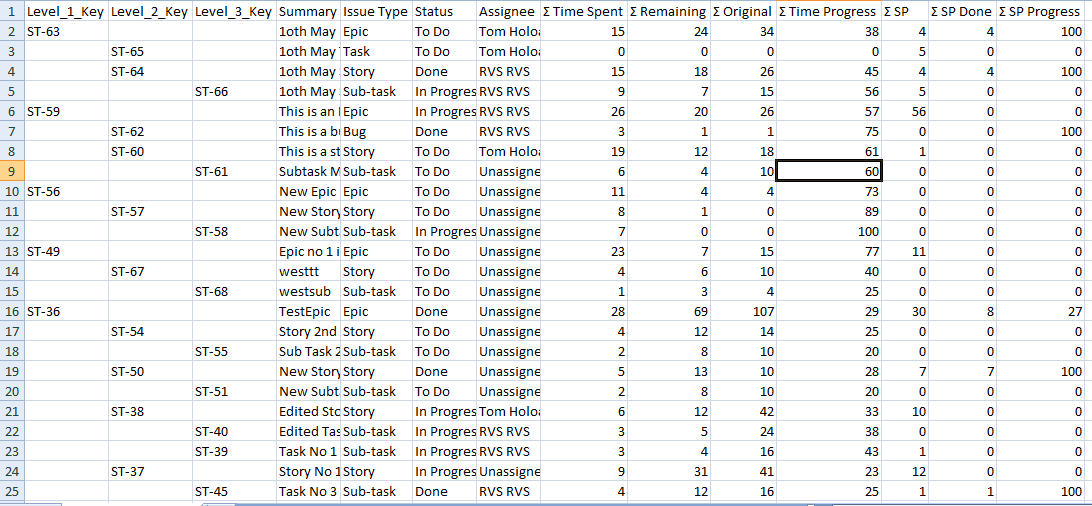
Export to Excel : Epic Hierarchy can be exported to Excel in CSV format by clicking on the Excel icon. The exported data shows complete hierarchy as in the screen shot below
How to view Portfolio/Advanced Roadmaps Hierarchy Reports
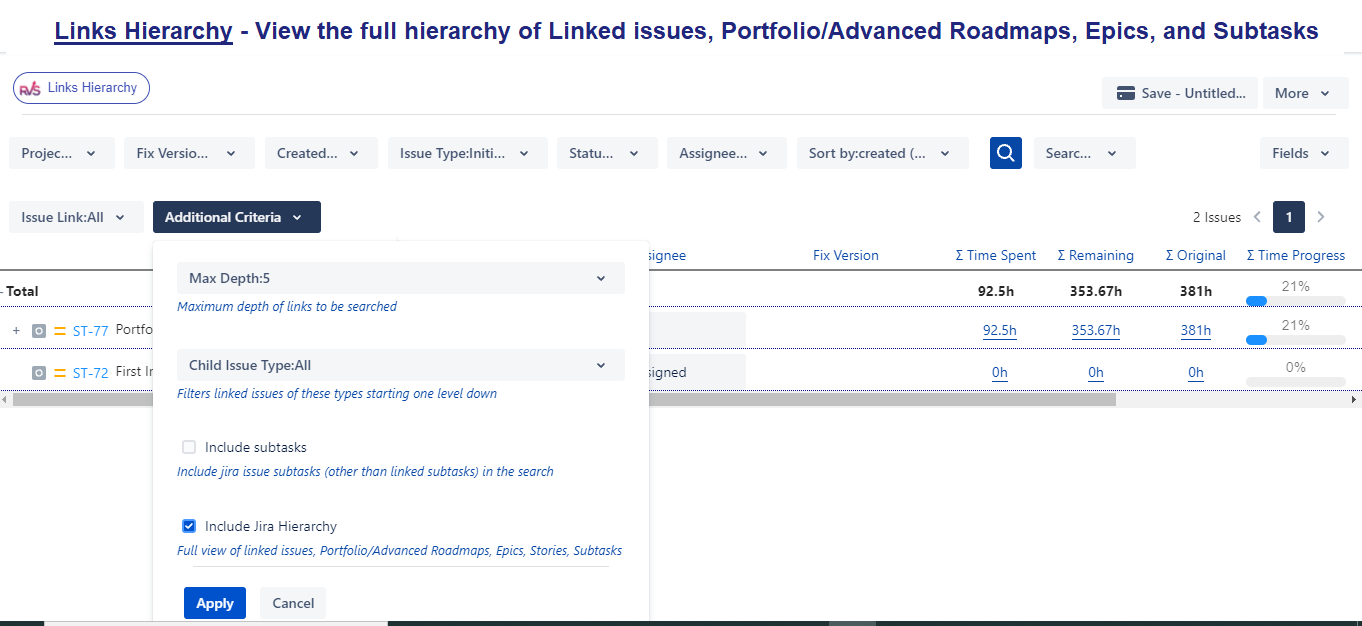
Clicking on “Links Hierarchy” will navigate to the below screen. The Portfolio/Advanced Roadmaps Hierarchy too can be visualized and tracked on this screen. For that you need to select your top level issue type, eg Initiative, from the “Issue Type” filter and select “Include Jira Hierarchy” from the additional search box.
Epic Hierarchy Report on Issue Screen
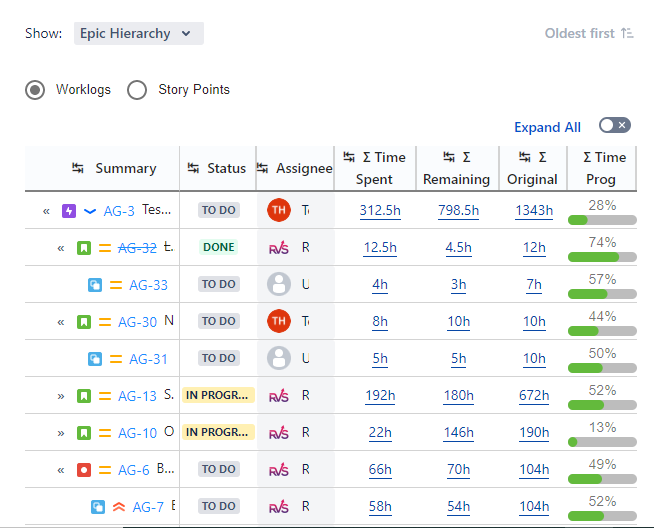
Epic Hierarchy can be viewed on Issue Screen as well. The hierarchy shown will be for the current Epic.
All the key fields are editable on this screen as well.
Cloud Edition : On Cloud the Epic Hierarchy is visible as a dropdown on the Activity section as shown below.
Links Hierarchy Reports
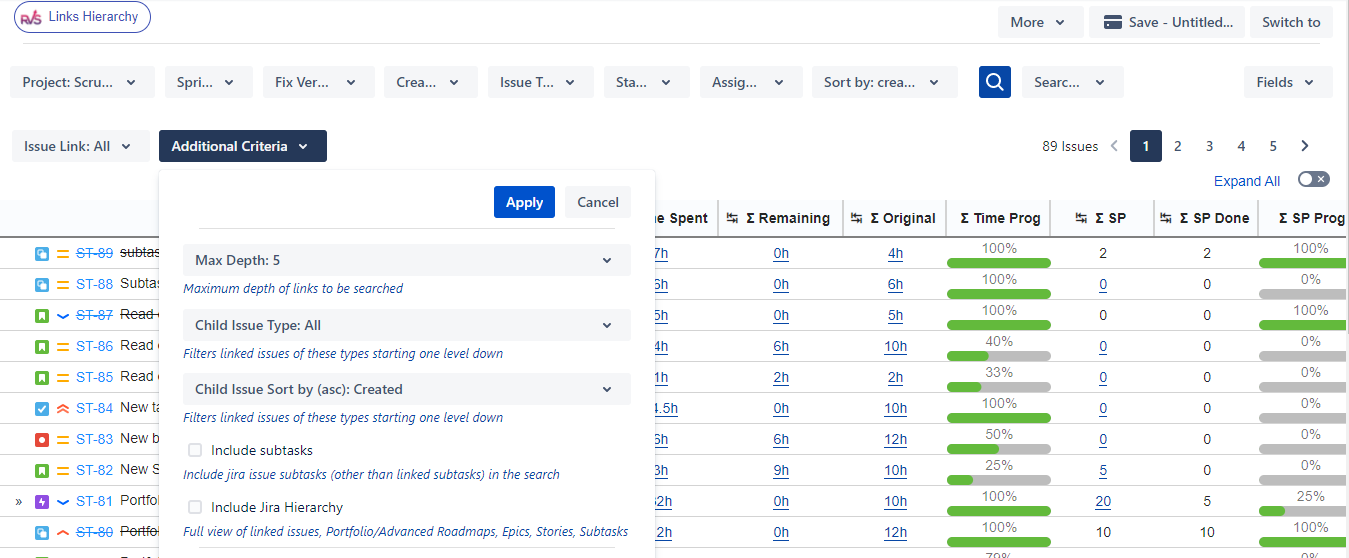
Clicking on “Links Hierarchy” will navigate to the below screen. Select a Project from the drop down. Either click on “Search” button to load all the links of the project or select a fix version/created date/issue type/status/assignee and load its details. You can also specify the Issue link and from Additional search criteria you can filter results based on max depth, child issue types and whether to include subtasks in the hierarchy.
Links Hierarchy also has an option to include your standard Jira Hierarchy (Epic → Story → Subtask) in the sum up calculations. You need to select the checkbox “Include Jira Hierarchy” as shown below.
Also the app allows to view the Portfolio/Advanced Roadmaps Hierarchy too. For that you need to select your top level issue type, eg Initiative, from the “Issue Type” filter and select “Include Jira Hierarchy” from the additional search box.
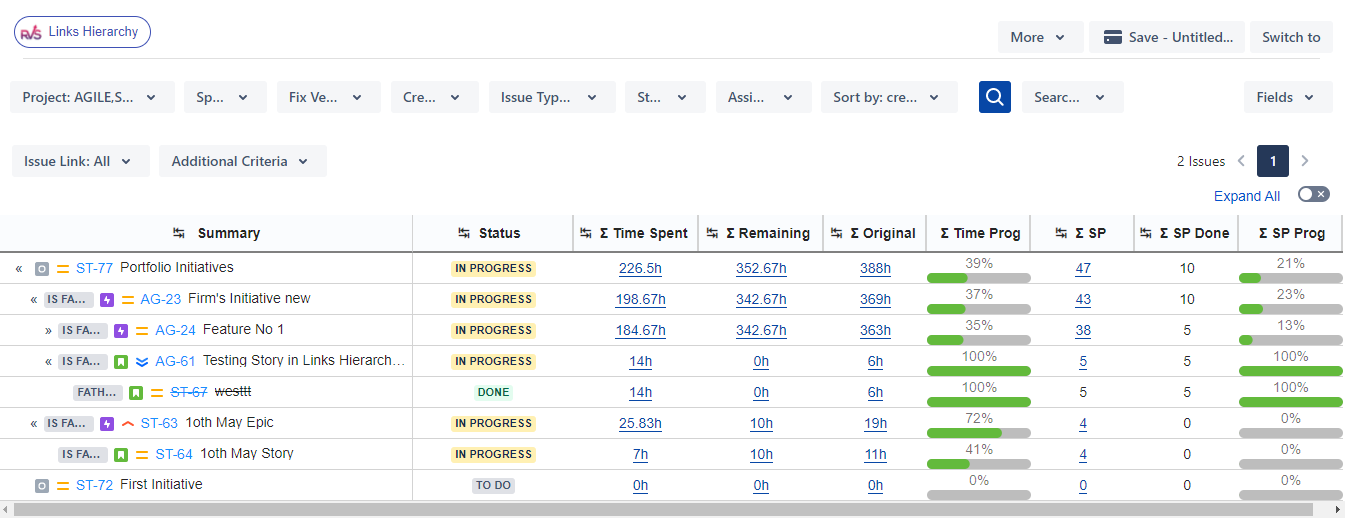
The report will show rolled up estimates (time/story points progress) at top level for all the issues linked inside.
Edit Issue Summary, Status, Assignees, Estimates or Story points right on the Hierarchy report.
Summary Report
You can view a quick summary of your projects using Summary Reports option on the Hierarchy Screens. This feature also allows to slice and dice your data using JQL and get a bird’s eye view of the progress.
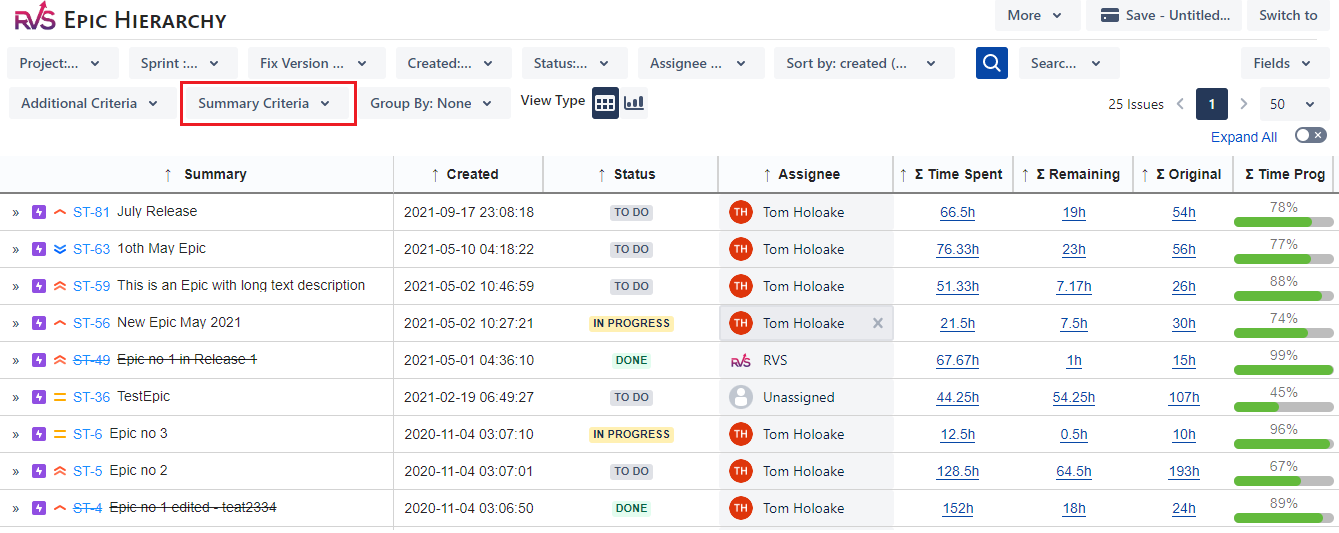
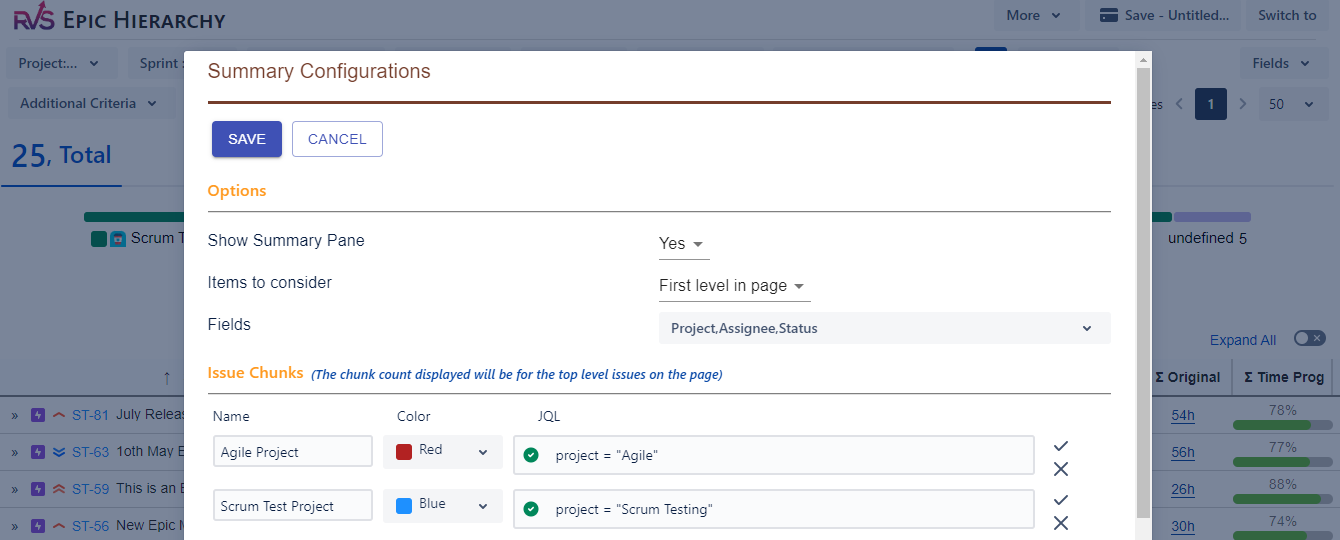
Clicking on the “Summary Criteria” drop down will open a popup as shown below.
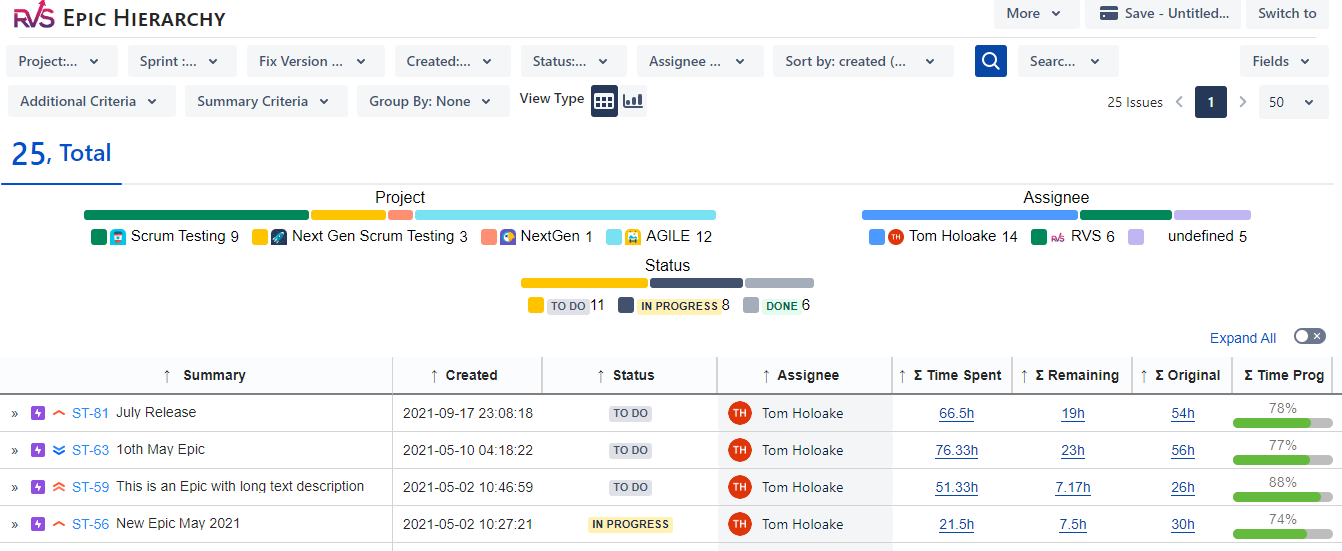
In the example below I have set :
Show Summary Pane = “Yes”
Consider Items only at 1st Level in hierarchy
Added the Fields Project. Assignee and Status
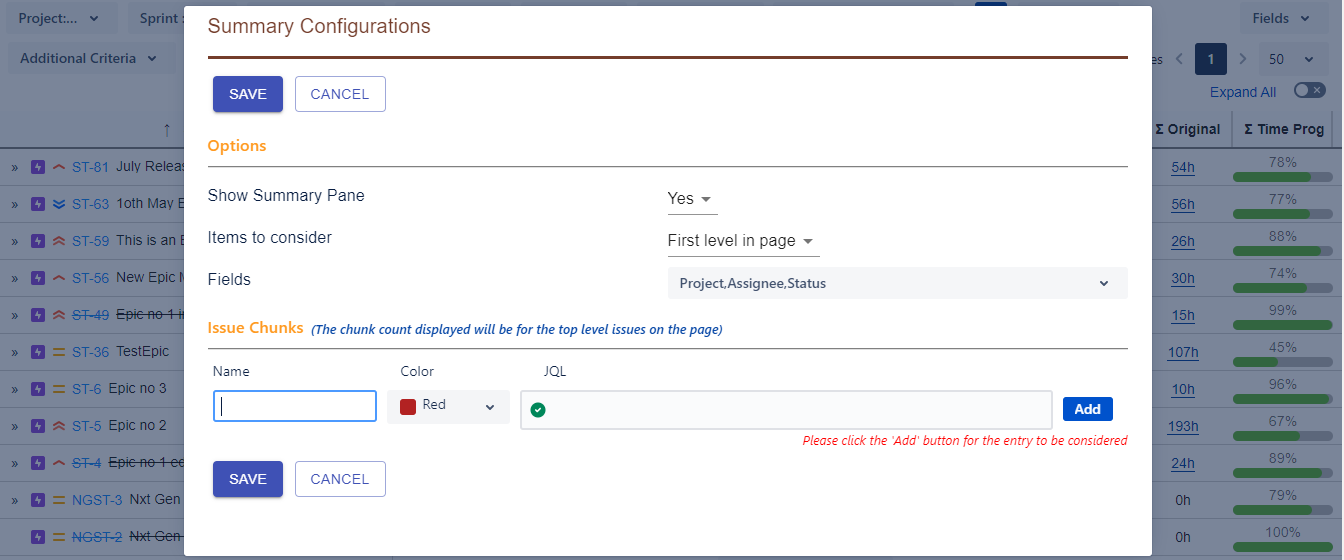
Based on above settings, the app will show summary bars as below.
You can also create your own issue chunks by specifying your custom JQL to further slice and dice your data.
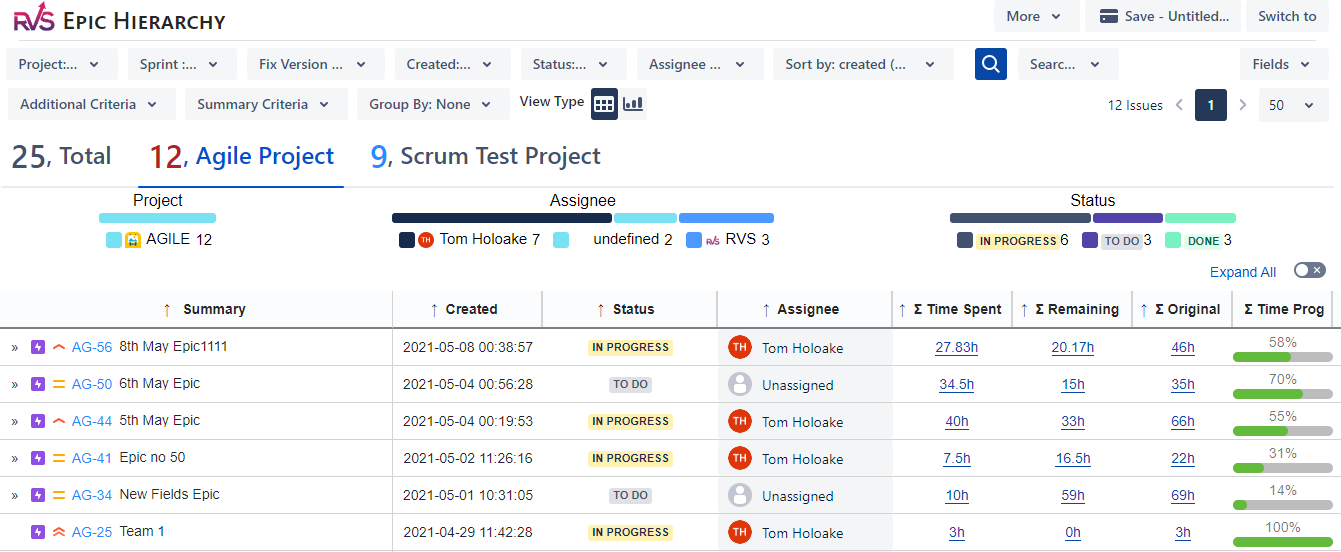
In the example below, I have created 2 issues chunks for filtering by Projects in the JQL option.
Saving this configuration, will create 2 tabs.
How Story Points Done are calculated?
The story points done are automatically calculated based on the status of the story .
That is if the status of a story = 'Done'
then
Story points done = Story points total
Else
Story points done = 0
How to View Custom Fields Roll Up Values
The app provides the option to view Roll Up / Sum Up, up to Parent Level, of your Number Custom Fields.
To view the same, please edit your displayed columns on the hierarchy screens.
The app will add a Sum Up Column for each of your number custom field and show up the Roll up value at the parent level.
Edit story point values
By Default the “Story Points total” are editable only on a user story level and are not considered for sum up at top level. If you need the Story points entered at task level to be considered for sum up at top level, please select the “Consider issues other than Story” to “Yes” in Issue Hierarchy Settings screen. The “Story points done” are automatically calculated based on the status of the story/task i.e
That is if the status of a story = 'Done'
then
Story points done = Story points total
Else
Story points done = 0
Also, once the story is marked 'Done' editing is dis-allowed
Issue Hierarchy Dashboard Gadgets
Issue Hierarchy gadgets can be added on Dashboards by clicking on Dashboards → <Your Dashboard Name> → Add Gadget. In the “Add a Gadget PopUp”, search for Votazz and it will show all the available gadgets which can be added.
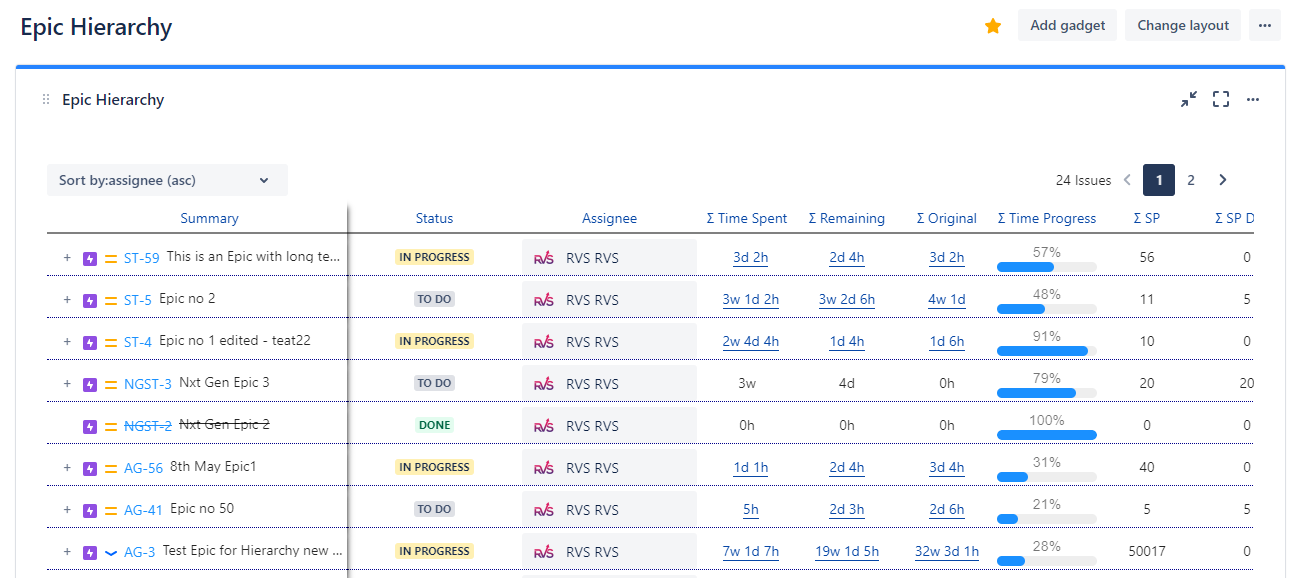
Epic Hierarchy Gadget Configuration
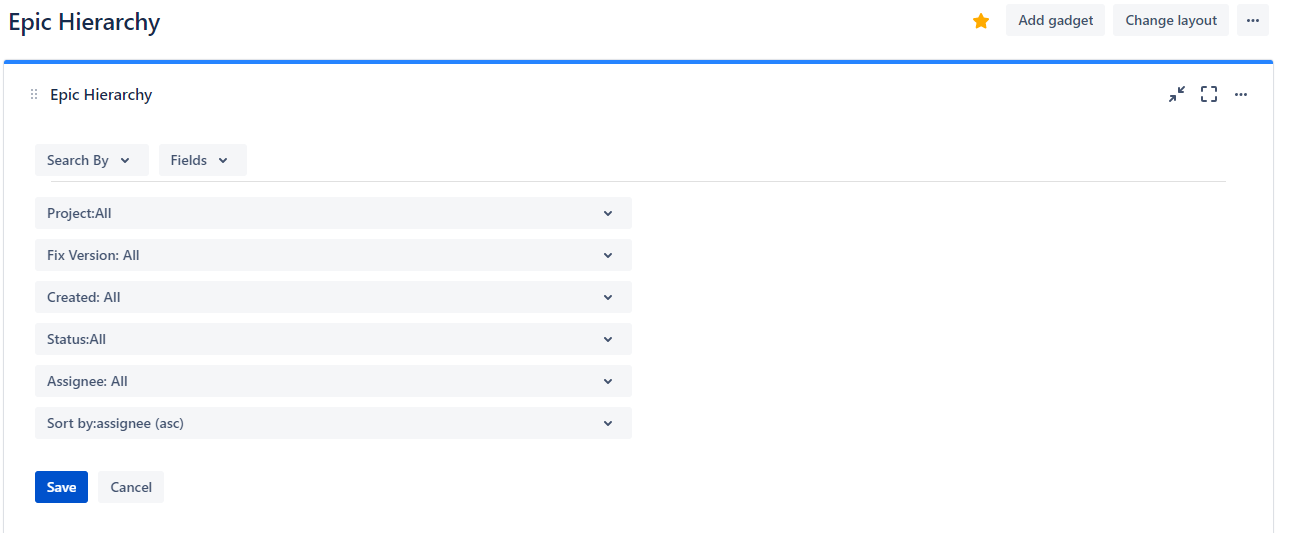
Epic Hierarchy Gadget
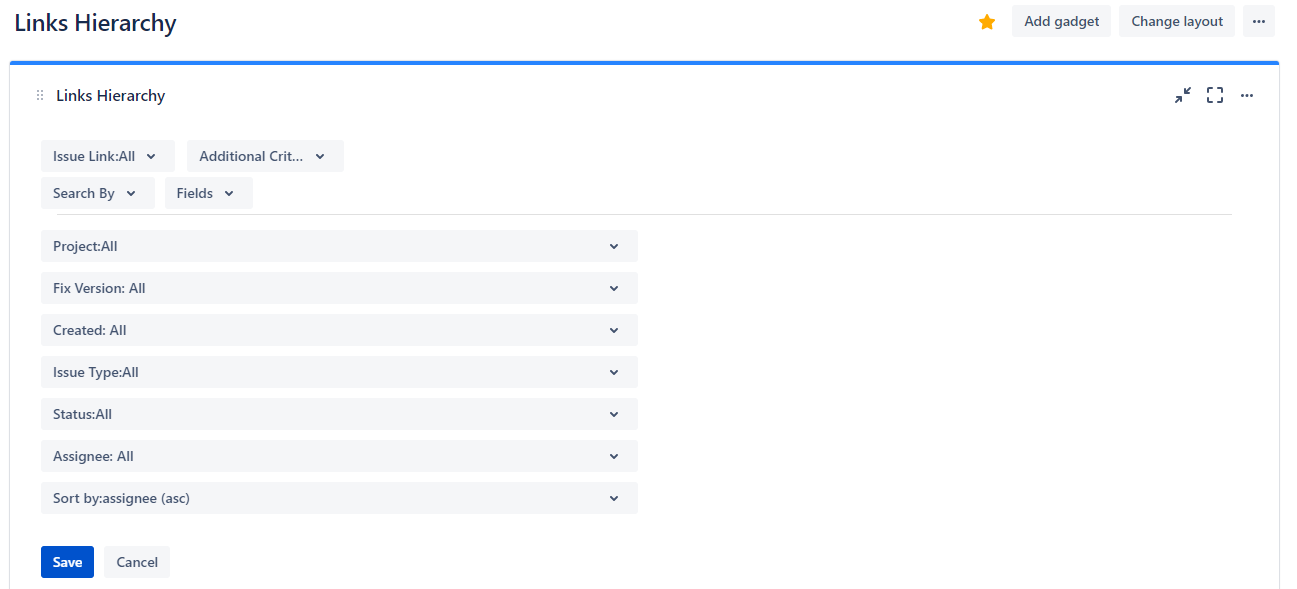
Links Hierarchy Gadget Configuration
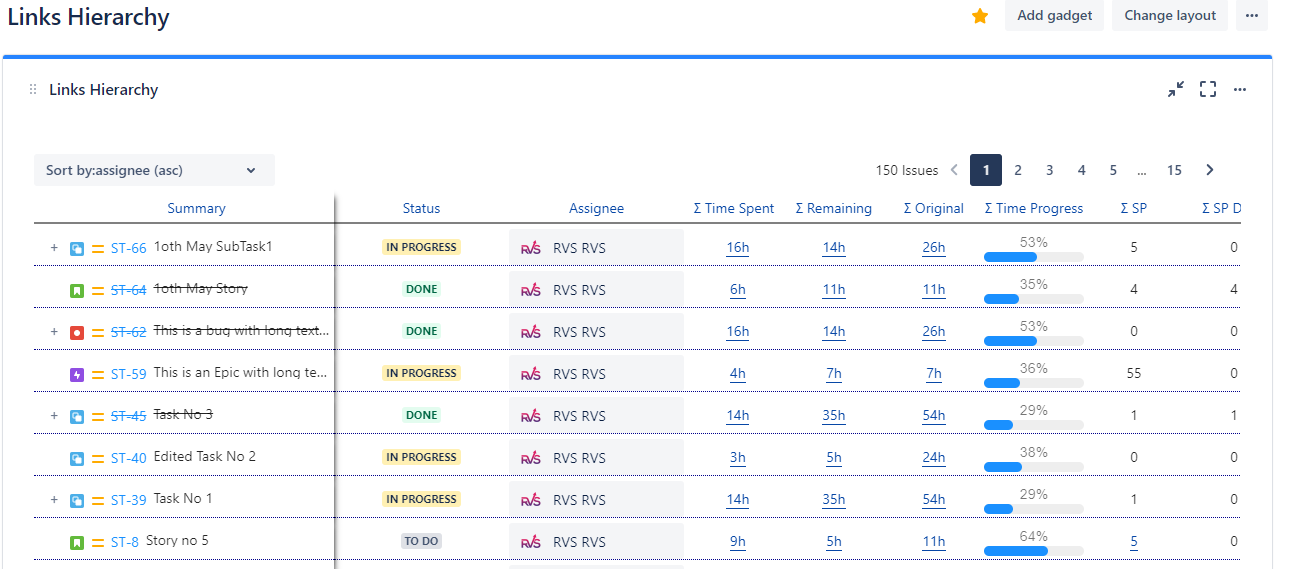
Links Hierarchy Gadget
Issue Hierarchy Settings
Settings for the app can be configured at two places:
Global Settings : Requires Jira admin privileges.
a. Jira Cloud : Navigate to Settings → Apps page. You will find Issue Hierarchy Reports → Hierarchy Settings link on the left navigation bar, as per screen shot below.
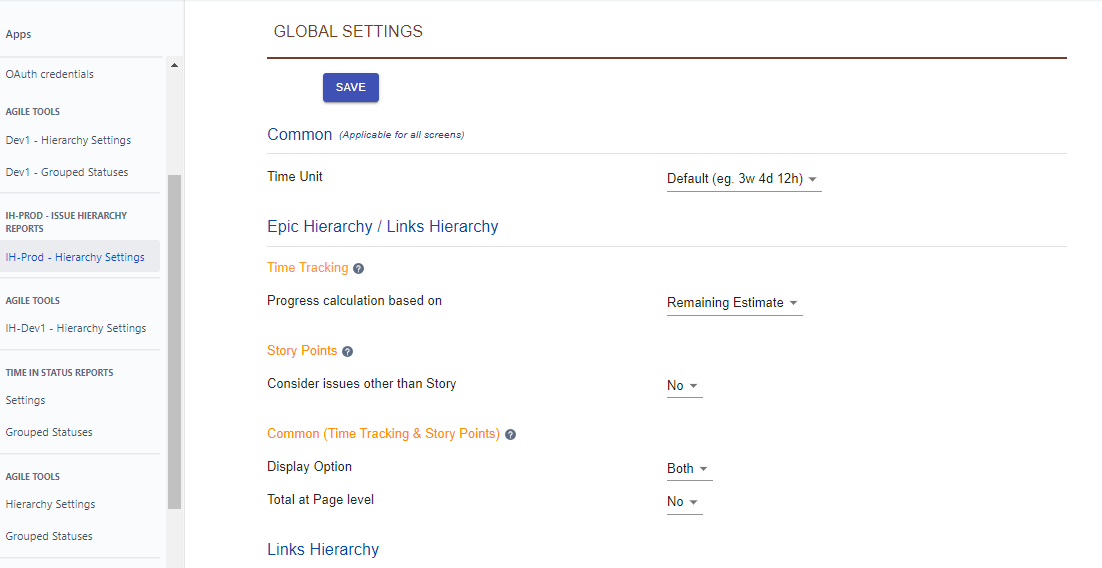
2. User Level Settings : User can override Global Settings, by changing the settings from any of the app
pages by clicking on the gear icon as below. The settings are per user and are cached locally on
each user’s machine.
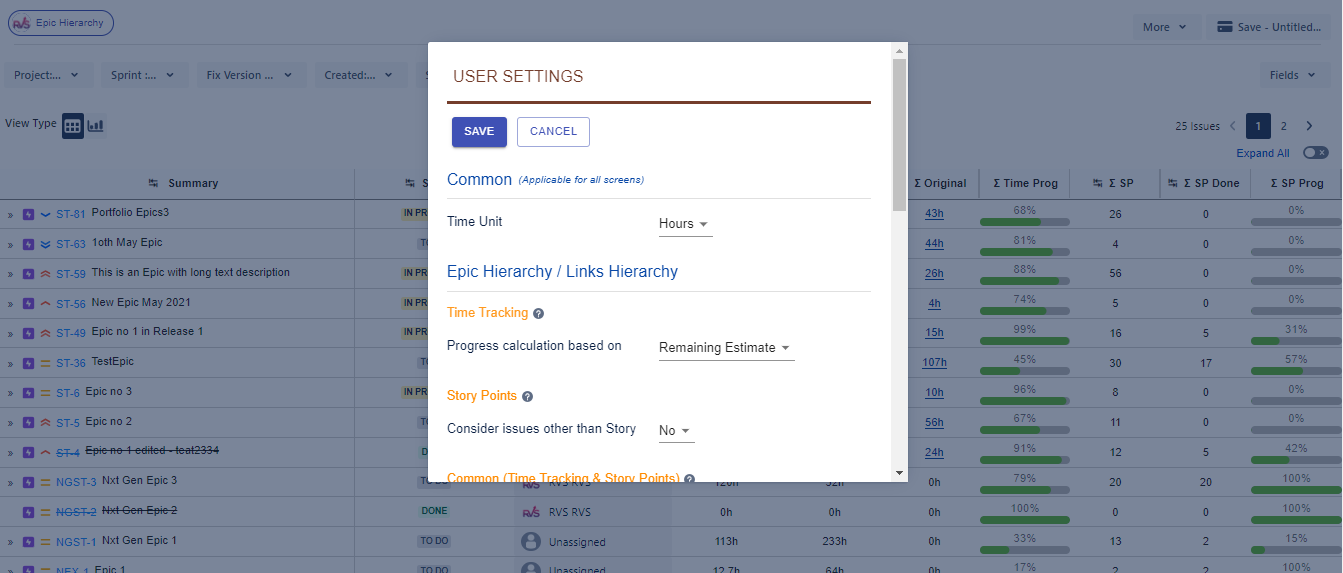
The below settings can be changed :
Common : The time unit display on all the reports can be changed from here to either hours/days/default. More details explained here.
Epic Hierarchy / Links Hierarchy:
Time Tracking progress : The time progress % of all the issues of your project can be based on either remaining estimate or original estimate calculation. The formulae to calculate the same is described in detail here.
Story Points: If you wish to include story points for issue types other than Story, select the option “Consider Issues other than Story” to “Yes”. More details explained here.
Common : You can hide/show the columns on Epic Hierarchy through this setting. More details explained here.
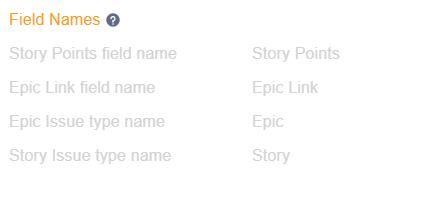
Field Names: If the Issue type names have been changed in your Jira instance you need to specify them in the global settings.
Hierarchy Reports Settings
The Settings on this section are applicable to Epic Hierarchy and Links Hierarchy screens.
Hierarchy Report - Common Settings
The common settings are set at Global level by the Jira admin and can be overridden by the user. The following options are available in this section.
Display Option : You can hide the worklog or story points columns on the screen by changing this setting. This setting will be overridden if you have changed the displayed fields on any of the Agile Tools screens.
Total at Page level : If you want to view the total of all Epic Hierarchy columns at each page level, you can change the value of this drop down to “Yes”.

Field Names: App looks for Epic & Story field names. If these Issue type names have been changed in your Jira instance you need to specify them in the Global settings.
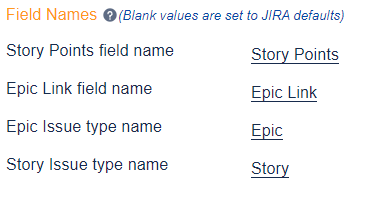
These field names are non editable on User settings page. They can only be set by the Jira admin on Global settings page.
How Track Progress % is calculated
Progress Calculation based on Remaining Estimate :
Progress percentage is percentage of ‘Time Spent' (Time Tracking) out of the total 'Time Spent’ + 'Remaining Estimate'. For example, if
Time Spent = 3h
Remaining Estimate = 12h
Progress = (3 / (3+12) )*100 = 20%
Progress Calculation based on Original Estimate :
Progress percentage is percentage of 'Time Spent' (Time Tracking) out of the total 'Original Estimate'. For example, if
Time Spent = 4h
Original Estimate = 8h
Progress = (4 / 8)*100 = 50%
How are Time tracking fields calculated?
In Jira by default, Users can enter any values in Time Spent, Remaining Estimate & Original Estimate. And there is no interdependency between these fields. Except for one place where if both 'Remaining' and 'Original' are set 0, any update to either column will have the same value updated in other column. This add-on maintains the same functionality.
Hierarchy Report - Story Points
If you wish to include story points for issue types other than Story, select the option “Consider Issues other than Story” to “Yes”.

Issue Hierarchy - Common Settings
This setting is applicable to all the reports.
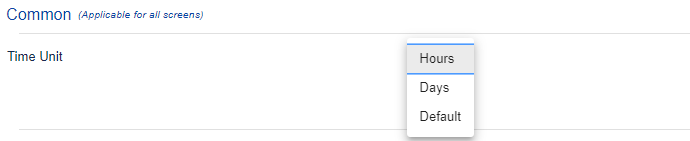
Time Unit : The time unit display on all the reports can be changed from here to either hours/days/default.
Epic Hierarchy Report Additional Settings
Maximum no of Epics to Export: You can set how many issues can be exported to Excel from Epic Hierarchy screen. Max number allowed is 100.

Display Fields/Columns on the Reports
App provides the option to add/remove columns on all the screens. There can be different columns shown on each of the reports as each screen details are saved separately.
Click on “Fields” Button on top right of the report. It will open the pop-up as shown below and you can add/ remove them as per your needs. You can also change the ordering of the displayed columns.
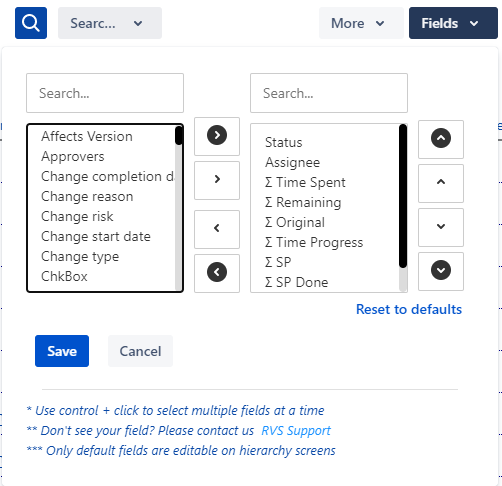
Reset to Defaults option :- The Reset to default option on the Fields pop-up is linked to the “Display Option” on the Settings screen.
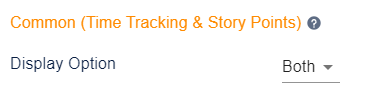
If you have selected “Both” in this setting then clicking on “Reset to default” will select all the time tracking and story points fields.
If you have selected “Worklogs” in this setting then clicking on “Reset to default” will select only the time tracking fields.
If you have selected “Story Points” in this setting then clicking on “Reset to default” will select only the story points fields.
Issue Hierarchy Prerequisites
Issue Hierarchy add-on looks for the “Story Points” and “Time Tracking” fields in Projects. Ensure you’re using these fields to estimate issues.
Please follow the below steps to enable the same
Navigate to Administration -> Issues -> Screens
a. Select your project’s “<Project Name>: Scrum Default Issue Screen”. Click on Configure
b. Add the following fields to this screen
i. Time Tracking
ii. Story Points
FAQs
Help & Support
Please raise a support request here, or email us at support@votazz.co.
To help us respond quickly and accurately, include the app version, your Jira version, your browser, and the steps to reproduce the issue with examples or screenshots.